In this week's edition: the cue from this floor is that there may be life in the old bull yet; and why European equity yields could be a silver lining.
In this week's edition: the cue from this floor is that there may be life in the old bull yet; and why European equity yields could be a silver lining.
April 9 2019
A Cue From the Floor
As at the end of July 2019, the US cycle will be 121 months old, the longest since records began in 1857.1 We hear already the cries of “economic cycles don’t die of old age” and we respect that, but we still think the proximity of the peak is a legitimate conversation to be having.
In light of this, we have taken inspiration from David M. Darst’s legendary schematic of the asset price cycle. Darst categorised market cycles as having five stages, as shown in Figure 1. Each part of the cycle is characterized by a statement (shown in italics in the graph) about fundamentals, valuation and psychological factors.
We asked a number of our investment professionals to select where they thought we were in the asset cycle, both overall and within each of the three cycle components, and we have overlaid the results onto Darst’s schematic. Two observations emerge. The first is that, on the headline level, although the modal stage is ‘Mid’, the results are clustered such that it looks like we are on the cusp of moving from ‘Mid’ to ‘Peak’.
Secondly – and as we have outlined with blue rectangles – currently, Fundamentals are leading Valuation, which is leading Psychology. In Darst’s original work, he found that the weighting of these three components was 40/30/30 in Mid, moving to 20/20/60 in Peak. In other words, historically you know it’s peak-time when buoyant sentiment starts to run away from you. This confirms both what our survey has told us – i.e. we may be close to peak but not there yet – and recent readings of positioning data: Morgan Stanley’s prime brokerage numbers have moved up since the lows of the fourth quarter of 2018, but are still nowhere near all-in; CFTC net non-commercial positions out of open interest are running at negative 3-year Z scores for both the S&P 500 Index and the Nasdaq; and State Street’s Global Institutional Investor Confidence metric is still around all-time lows.
So, we will be watching closely for sentiment indicators to start picking up. However, in the meantime, the cue from this floor is that there may be life in the old bull yet.
Figure 1: The Dot Plot
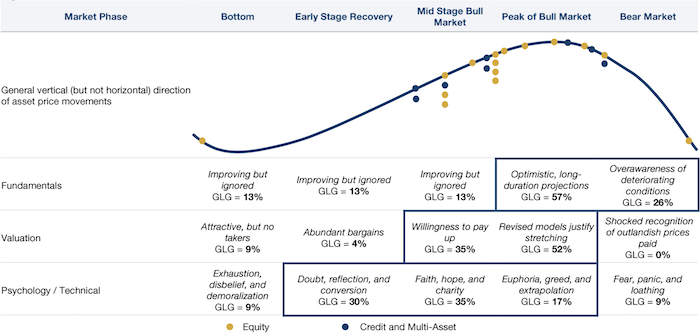
Source: Man Group, inspired by David M Darst; Survey conducted between March 1 and March 31.
European Equity Yields: A Silver Lining
If there is a silver lining in Europe, especially against low risk-free rates, it is European equity yields, in our view.
As Figure 2 shows, there is a notable gap between the cash yield (calculated as the dividend yield and buyback yield) and the 10-year bund yield. Additionally, almost 80% of European companies have a dividend yield greater the corporate bond yield (Figure 3). This compared with just 20% of US companies that have a dividend yield greater than the corporate bond yield.
Indeed, this yield characteristic may be valuable, especially against a backdrop of growth being very highly rated: high-growth stocks are trading in their highest premium to low-growth stocks since 2000, according to Goldman Sachs (Figure 4).
Figure 2: A High Gap Between European Cash Yields and Bund Yields
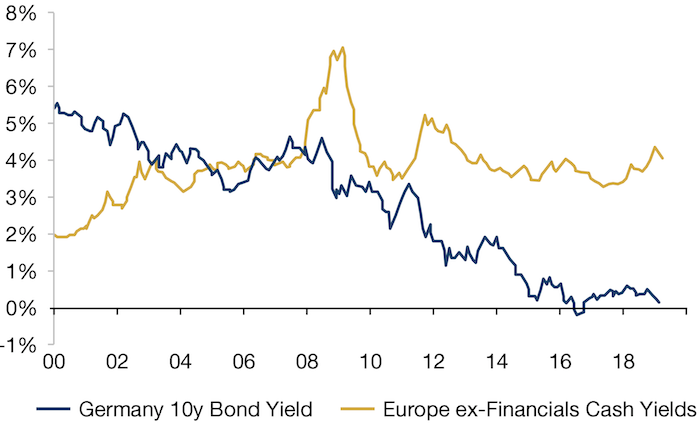
Source: Datastream, Factset, Goldman Sachs, as of March 29, 2019
Figure 3: Dividend Yields Are Higher Than Corporate Bond Yields
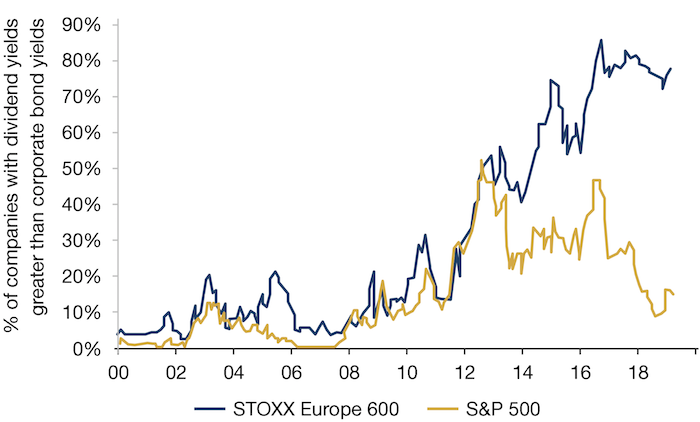
Source: Datastream, Factset, Goldman Sachs; as of March 29, 2019.
NOTE: Corporate bond yield is 75/25 IBOXX Euro corporate yield/ IBOXX sterling corporate yield for Europe and the 5-year BBB-corporate bond index for US.
Figure 4: Premium of High-Growth Stocks to Low-Growth Stocks
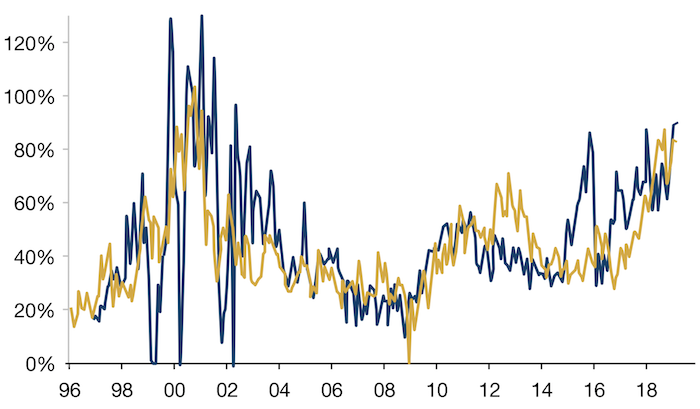
Source: Datastream, Factset, Goldman Sachs; as of March 29, 2019.
Europe represented by Stoxx Europe 600 Index; US represented by S&P 500 Index. High sales growth >8%; low sales growth <4%
With contribution from: Pierre-Henri Flamand (Man GLG, CIO) and Henry Neville (Man Solutions, Analyst).
1. Source: NBER
You are now exiting our website
Please be aware that you are now exiting the Man Institute | Man Group website. Links to our social media pages are provided only as a reference and courtesy to our users. Man Institute | Man Group has no control over such pages, does not recommend or endorse any opinions or non-Man Institute | Man Group related information or content of such sites and makes no warranties as to their content. Man Institute | Man Group assumes no liability for non Man Institute | Man Group related information contained in social media pages. Please note that the social media sites may have different terms of use, privacy and/or security policy from Man Institute | Man Group.