In this week’s edition: why we believe there is more stress to come in Turkey; and groundhog May – lots of news, but no change.
In this week’s edition: why we believe there is more stress to come in Turkey; and groundhog May – lots of news, but no change.
April 2 2019
Turkey: More Stress to Come?
On 1 April, President Recep Tayyip Erdogan was on track to lose control of Turkey’s two largest cities -- Ankara and possibly Istanbul -- for the first time in his 16 years in power. The two cities have been under the control of Erdogan’s Justice and Development (AKP) party since 1994. As such, we believe this is a big hit to the AKP party’s hold on power and to Erdogan in particular, whose political career took off in the mid-1990s as Istanbul’s mayor.
Municipal elections are important in Turkey because it is at this level that political parties source the funds that they use to finance their political activities. Hence, by losing a grip on the municipal governments, Erdogan loses access to the money that he needs to stay in power.
From the market’s perspective, in the previous two weeks, authorities banned local banks from providing Turkish lira (‘TRY’) funding to offshore market participants. This forced those players to liquidate US dollars into TRY spot to avoid paying overnight rights that, at some point, exceeded 100,000% annually compounded. This happened in a context where offshore participants had been receiving local rates via FX swaps. We believe that as such swaps expire over the next few weeks, most of the US dollars – that were sold during the pre-election squeeze – will be bought back.
Longer term, we believe the stunt pulled by the Turkish authorities last week will help convince European banks to continue to exit their loan exposure to the Turkish banking system, which will further stress the local banking and corporate sectors.
Problems loading this infographic? - Please click here
As of 1 April, 2019.
Groundhog May
Britain’s battle over how, and when, to leave the EU will be on the cards this week – again.
After rejecting Theresa May’s Brexit deal for a third time on 29 March – the day Britain was originally scheduled to leave the EU – MPs will hold more indicative votes this week. This will occur despite May offering to stand down if her deal was accepted and in spite of getting Brexiteers Boris Johnson and Jacob Rees-Mogg on her side.
Over the weekend (30-31 March), there have been rumours that May could call snap elections. We believe this could be a last-ditch attempt by May to scare the Conservatives into accepting her deal – a snap election could result in the Labour party taking control of Parliament.
The clock is ticking -- Brexit is (currently) due on 12 April.
Is There Value in Low Vol?
Money has been pouring into low-vol funds: the iShares Edge MSCI Min Vol USA ETF (USMV) has attracted about $2.6 billion in net creations so far this year, while its main competitor, the Invesco S&P 500 Low Volatility ETF (SPLV), has seen about $842 million in net inflows (Figure 2).1 The current aggregate assets are about 45% higher than the prior flood of money into low-vol ETFs in the summer of 2016, according to our calculations.
The inflows come despite low-vol stocks being expensive: Figure 3 looks at the largest 1,000 stocks by market cap globally and shows the Barra Value Exposure for 20% of those companies that have the lowest total risk (as measure by idiosyncratic vol). Historically, those low-risk stocks have been cheap (positive Value exposure), but are now expensive (negative Value exposure).
Separately, short interest in both the above named ETFs has remained muted, at roughly 2%. This is very different to 2016, the last time we saw significant inflows, where short interest spiked to more than 3%. Perhaps investors saw low vol as a bubble in 2016, while they now see it as protection from an inverted yield curve.
Figure 2: Value, Short Interest of Low-Vol ETFs
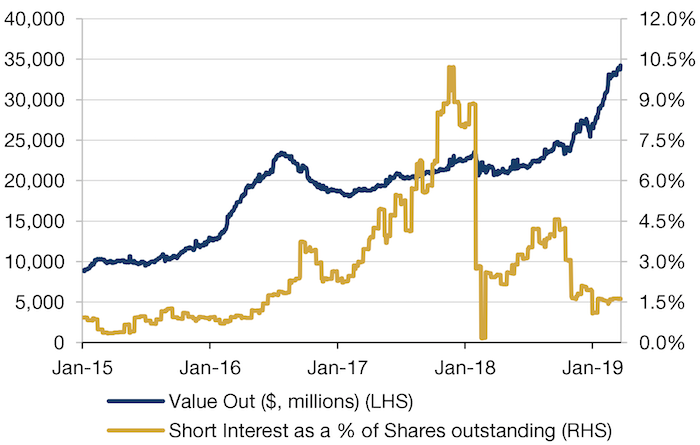
Man Numeric, Bloomberg; As of 22 March, 2019.
Problems loading this infographic? - Please click here
Man Numeric, As of March 2019.
Shiller CAPE Ratio: Slightly Better, Nowhere Near Good
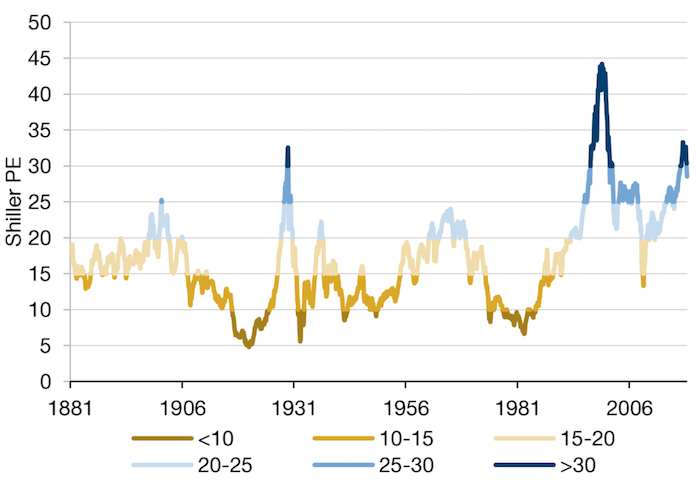
The real Shiller cyclically adjusted price-to-earnings ratio (‘Shiller CAPE’) has fallen to 28.7 as of 1 February, 2019. This is the first time since August 2017 that the ratio has dropped below 30 (Figure 3). Previous instances of a reading above 30 were during the 1929 Wall Street Crash and the collapse of the dot com bubble.
Based on historical precedent, a reading between 25 and 30 would imply a 10-year forward compound annual earnings growth rate (‘CAGR’) of around 2% in real terms, or roughly 4% in nominal terms, according to our calculations (Figure 4).
Additionally, we would point out that, going forward, the CAPE may be suppressed driven by base effects: the denominator uses 10-year trend earnings, which means that the next 12 months will see some of the very low earnings-per-share (‘EPS’) numbers – registered in the wake of the Great Financial Crisis (‘GFC’) – dropping out of the calculation. As such, we might see the projected CAGR improve over the medium term, based on purely technical forces.
Figure 4: Shiller CAPE Ratio
As of February 2019.
Problems loading this infographic? - Please click here
As of February 2019.
With contribution from: Guillermo Osses (Man GLG, Portfolio Manager), Thomas Flury (Man AHL, Deputy Head of Research), Rob Furdak (Man Numeric, co-CIO), Dan Taylor (Man Numeric, co-CIO) and Henry Neville (Man Solutions, Analyst).
1. https://www.etf.com/sections/features-and-news/more-low-vol-etfs-volati…
You are now exiting our website
Please be aware that you are now exiting the Man Institute | Man Group website. Links to our social media pages are provided only as a reference and courtesy to our users. Man Institute | Man Group has no control over such pages, does not recommend or endorse any opinions or non-Man Institute | Man Group related information or content of such sites and makes no warranties as to their content. Man Institute | Man Group assumes no liability for non Man Institute | Man Group related information contained in social media pages. Please note that the social media sites may have different terms of use, privacy and/or security policy from Man Institute | Man Group.