Three spontaneous and unrelated market musings: the overvaluation of the pound, how an inflation rollover doesn’t mean the end of an inflationary cycle and importance of free cash flow.
Three spontaneous and unrelated market musings: the overvaluation of the pound, how an inflation rollover doesn’t mean the end of an inflationary cycle and importance of free cash flow.
May 2022
Here are three musings we’ve been having since we last wrote.
All data is as of 11 May unless otherwise stated.
1. GBP Weakness: Once More Unto the Breach, Dear Friends
The pound sterling has fallen 9.5% year to date against the US dollar. The market anticipates the inflationary heat will burn brighter in Albion, with the Street estimating UK prices will rise 6% over the next 12 months, versus 5.5% for the US. Simultaneously, rhetoric coming out of the Old Lady of Threadneedle feels more dovish than that eliciting from the Federal Reserve. Consequently, the market has moved to price in rate hikes of 0.9 25bp increases per meeting for the Bank of England over the remainder of the year, compared with 1.5 from Powell’s Federal Open Market Committee. Greater inflationary pressure, combined with a perceived lesser inclination to combat it, has been negative for the pound’s prospects, to say nothing of the return of Brexit risk, with the Northern Ireland protocol re-emerging as a Gordian knot.
But has the sell-off gone too far? We certainly believe the upside is getting more interesting, from these levels. Figure 1 shows spot sterling (navy blue line), fair value based on purchasing power parity models (light blue line), and the difference between the two (the yellow bars). Three regimes present themselves. Pre-Big Bang, the pound was persistently undervalued, by between 0-30%. From Big Bang to Brexit, it was persistently overvalued, by the same magnitude, in the other direction. Since Brexit, it has reverted to undervaluation, but by a smaller amount, between 0-10%.
Today, the discount to fair value stands at 11%, so right at the bottom of the range in its current regime. A 6-month GBPUSD call option with a strike 3% above spot, and a knockout 3% below, is being priced so as to yield a 6x payoff if sterling returns to a 5% discount to fair value. Catalysts for such a move could be an unwind of highly bearish positioning (around 25% net short, according to CFTC data, 1.5 standard deviations below the trailing 3-year average), itself perhaps sparked by a reassessment of the Fed’s relative monetary aggressiveness.
Figure 1. GBPUSD, Spot Versus Fair Value
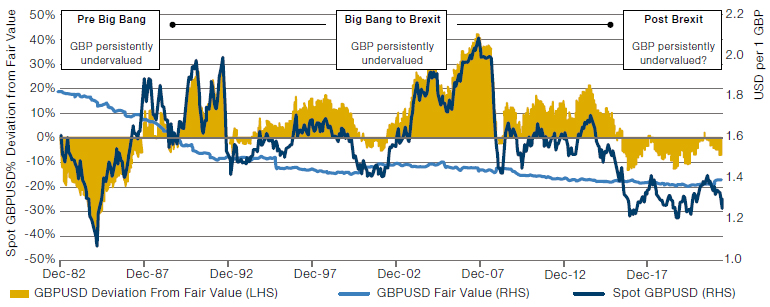
Source: Fair value is the average of estimates by the OECD and Bloomberg, based on PPP models. As of 16 May 2022.
2. Inflation Rollover: Of Battles and Wars
When we published our Inflation Regime Roadmap in June 2020, predicting an episode of intense inflationary pressure, US prices were rising just 0.6% year-on-year, and a number of our readers heckled us, in a polite British sort of way. When we published The Best Strategies for Inflationary Times in March 2021, the number was still only 2.6%, above the Federal Reserve’s target, but very clearly transitory, as Jay assured us. Today, with inflation well north of 8%, the consensus is that we are on the verge of a rollover and, while it’s tempting to be contrarian again…we think that’s probably right. As we wrote in our inaugural The Road Ahead our models are indeed now forecasting a decline to around 4% over the next 12 months.
But an episode is different from a regime.
But an episode is different from a regime. In January 1970, one Fire episode (high and rising inflation) finished with the rate peaking at 6.2%. But the regime had only just begun, with two more such episodes, and of increasing vigour, still to come. The last of which peaked at 14.8% in March 1980, some ten years later.1 We think it likely we are in a similar place today: the first battle is over, but the war has just begun.
Figure 2 shows the prediction ‘track record’ of the 5-year 5-year, a measure of what investors expect the 5-year inflation rate to be in five years’ time. Between 2004 and 2010, the 5-year 5-year persistently over-anticipated what inflation would be between 2009 and 2020. We believe the regime of the next 10 years will be the opposite, with multiple Fire episodes causing realised inflation to consistently outstrip that which the market had been anticipating.
Figure 2. The Forecasting Record of the US 5-Year 5-Year
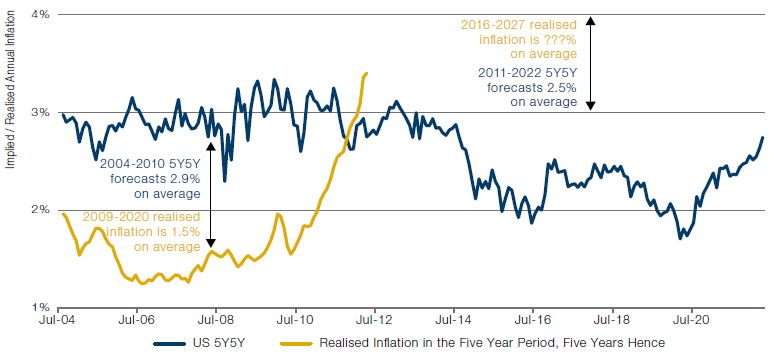
Source: Bloomberg, Man DNA team calculations. As of 16 May 2022.
3. Free Cash Flow Yield: Cometh the Hour
The last cycle was a tough one for Value investors. From the end of 2008 to the end of 2020, the result of going long MSCI USA Value and short MSCI USA Growth (the light blue line in Figure 3 was a drawdown of 57%. A whole generation of investors were taught that Value always works in the long run, and going through 2020, this traditional folklore of finance was starting to look outmoded. But over the last two years, the empire has decidedly struck back. In 2022 to date, this same strategy is up 27%.
All this is well understood. But there are a couple of nuances, we think, that are less well registered. The first is that Value over Growth is not the same as cheap over expensive. The MSCI Value index selects cheap stocks based on book value, earnings and dividend yields. The MSCI Growth index is not the opposite of this, but instead a group of companies with high earnings, sales and internal growth rates.
Where we take just a single Value-related accounting metric, and construct a long/ short portfolio driven by that alone, the results can look very different. The navy blue and yellow lines in Figure 3 show the results of this exercise using free cash flow yield and earnings yield respectively. One can see that their performance is entirely different from the long/short Value/Growth strategy. Getting into the detail explains why; for instance in 2013-14, Apple’s free cash flow yield hovered around 20%, versus some 7% for the S&P 500. At the same time its 5-year EBIT CAGR was around 40%. It is possible to be cheap on one lens, and fast growing on another.
Secondly, not all accounting metrics are created equal. Our preferred gauge of Value is the free cash flow yield. It is less prone to manipulation than book value or earnings, is a better measure of profitability given it incorporates the expansion of the economic capital base required to generate it, and, especially important in the current rising rate environment, it is the ultimate measure of financial sustainability. When liquidity is drying up, those that have it on tap should trade at a premium. Despite this logic, as well as the superior empirics demonstrated in Figure 3 (almost 0.3 Sharpe points ahead of earnings yield), we find the metric to be sadly underutilised. Cash, though born free, is everywhere in chains.
Figure 3. Performance of Different Flavours of Value
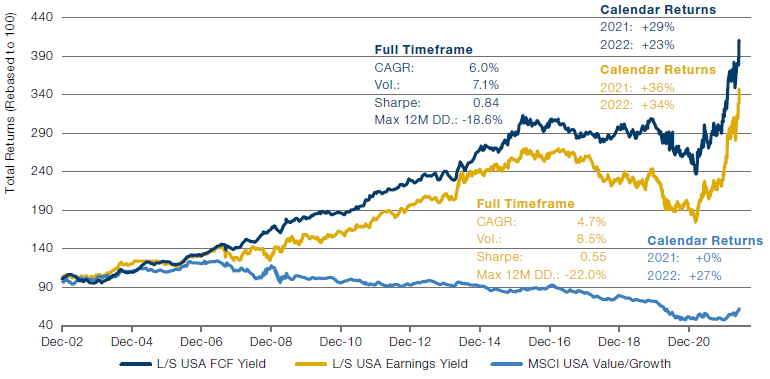
Source: Bloomberg, MSCI, Man DNA team calculations; as of 16 May 2022.
Please see the important information linked at the end of this document for additional information on hypothetical results.
1. Bloomberg, Federal Reserve Bank of St Louis.
You are now exiting our website
Please be aware that you are now exiting the Man Institute | Man Group website. Links to our social media pages are provided only as a reference and courtesy to our users. Man Institute | Man Group has no control over such pages, does not recommend or endorse any opinions or non-Man Institute | Man Group related information or content of such sites and makes no warranties as to their content. Man Institute | Man Group assumes no liability for non Man Institute | Man Group related information contained in social media pages. Please note that the social media sites may have different terms of use, privacy and/or security policy from Man Institute | Man Group.