The themes that dominated 2022 are once again set to dominate 2023. How should investors respond this time around?
The themes that dominated 2022 are once again set to dominate 2023. How should investors respond this time around?
December 2022

Introduction
We’ve all had it. The Christmas gift from a loved one which is so truly hideous that shoving it out of sight in a cupboard is simply not enough. Despite being hidden behind a broken vacuum cleaner and that weird bowl from the wedding list that you’ve always been meaning to use, the gift is so awful that the bad vibes are still floating around the house. There is only one solution: regifting. Palm it off. Get rid. Give it to your mother-in-law, and sleep peacefully once more.
Now this is all very well if you are the one doing the regifting. But what if you’re the unsuspecting one who has just received the awful regift?
What if 2023 is a drawn-out repeat of 2022? It would be the bad regift to end all regifts.
From the perspective of most investors, 2022 was one of unrelenting grimness. But even grimmer news may be on the horizon. What if 2023 is a drawn-out repeat of 2022? It would be the bad regift to end all regifts. We face very similar concerns to the start of 2022 – investors must manage rising correlations between asset classes, and account for the Federal Reserve’s hiking cycle which is driving returns across most markets. Desperate to find a Fed pivot and end to inflation, investors are likely to remain hooked on Jerome Powell’s every word and glued to every data point.
Nowhere is this more obvious than a quick analysis of the most frequently used terms across various 2023 outlook pieces from sell-side research houses (Figure 1). The same 2022 problems come up again and again: inflation, energy, supply chains, and the actions of the Fed. The negative GDP periods of 2022 are now being debated through the prism of hard or soft landing.
Faced with repeating themes from 2022, how should investors best position themselves to cope with 2023?
Figure 1. The Most Frequent Terms in 2023 Outlooks
Problems loading this infographic? - Please click here
Source: Selected research houses, Man Solutions; as of 2 December 2022.
Strategists: Paid to Publish, Accuracy Not Guaranteed
As bank strategists and economists fill your email in box with forecasts for the year ahead, how should you process it all? Let’s admit it, most of us are driven by our confirmation bias. We weight most heavily those outlook research pieces that are most consistent with our own expectations and thus, flush with cherry-picked supporting data, carry on. Then there are those forecasters who want to have their Christmas cake and eat it, too, by calling for equity declines early in the year followed by year-end rallies to hit new highs.
Of course, you could try some statistical approach to the whole thing. And some journalists with access to all of them give that a go. Heading into 2022, the aggregate conversation was inflation would be transitory, bonds would show modest returns, and the S&P 500 was expected to be up 7.5%1 – so much for the wisdom of crowds…
What if everything that went wrong in 2022 continues to go wrong in 2023 – in exactly the same way.
Instead, if we consider the theme of 2023 as 2022 but on repeat, it might make sense for investors to start with what the worst-case scenario might look like. In essence, what if everything that went wrong in 2022 continues to go wrong in 2023 – in exactly the same way (Figure 2)? That would leave equities 38% lower than they were at the end of 2021, rates in ten-year bonds at 6.3%, crude soaring back over 115, and bitcoin around 5000 down 87.5% in two years. Although given the volatility cryptocurrency investors have already seen, this last option might almost seem normal.
Figure 2. 2022 on Repeat: 2023 Implied Asset Price Ranges
Problems loading this infographic? - Please click here
Source: Bloomberg; as of 9 December 2022. Please see the important information linked at the end of this document for additional information on hypothetical results.
Manage Correlation or Take a Big Directional Bet
So if the range of published outlooks are confusing – or otherwise contradictory – what is a prudent investor to do?
The first major challenge of 2022 that we expect to persist in 2023 has been the re-emergence of stock-bond positive correlations. While over the very long term, stocks and bonds have been positively correlated, we have seen consistent negative correlation during the past 20 years (Figure 3). This all changed in 2022: the re-assertion of positive correlation came during a persistent cross-asset selloff, with disastrous consequences for managers.
Figure 3. Stock Bond Correlation (Trailing 10-Year, Monthly Periodicity)
Problems loading this infographic? - Please click here
Source: Man Solutions; as of 1 December 2022. Please see the important information linked at the end of this document for additional information on hypothetical results.
Coming into 2022, both bonds and equities were especially expensive in historical terms.
The driving force behind the moves was inflation, which affected asset prices in two ways. Firstly, higher inflation, all things equal, tends to drive rates higher. This, in turn, decreases the theoretical price of assets in a discounted cash flow model. Coming into 2022, both bond and equities were exceptionally expensive in historical terms (Figure 4). As such, the bond/equity correlation sharply increased as both asset classes fell.
Figure 4. Shiller PE ratio and US 10-Year Yield
Problems loading this infographic? - Please click here
Source: Robert Shiller, Man Solutions; as of 1 December 2022.
Investors seem to be assuming inflation falling to 5-6% may be enough, but that seems to miss Powell’s message of higher for longer.
It is notable that over a long history, negative correlation is most associated with a period in which inflation was persistently falling and reached unprecedently low levels. Inflation is almost certainly likely to moderate in 2023, largely due to base effects. However, given all the issues in supply chains, wage inflation and other factors such heavily weighted items such as energy and food in the CPI calculation, it is difficult to imagine that inflation falls back under the 2% target used by the Fed, the European Central Bank (‘ECB’) and the Bank of England (‘BoE’). Investors seem to be assuming inflation falling to 5-6% may be enough, but that seems to miss Powell’s message of higher for longer. An inflation move below 2% may be only the result of a jobs recession and an extremely hard landing — which will improve correlations but destroy portfolios. If the Fed followed the Taylor Rule, the Fed funds rate might end up much higher than even the wildest of predictions, which might mean more 50-75 bp hikes in 2023 (Figure 5).
Figure 5. Taylor Rule-Implied Fed Funds Rate
Problems loading this infographic? - Please click here
Source: Man Solutions, Bloomberg; as of 12 December 2022.
With positive bond-equity correlation, portfolio volatility will remain uncomfortably high.
The net effect, we believe, is that investors need to be very active about managing the use of bonds in their portfolios as correlations change. With positive bond-equity correlation, high bond and even just moderately high equity volatility, portfolio volatility may remain uncomfortably high and returns in both assets may remain negative going well beyond the good old days of negative correlations. In our view, managing this correlation, will be key to navigating 2023.
Positive correlations are not just limited to stocks and bonds (Figure 6). Indeed, cross-asset correlations are at all-time highs, making the process of managing money deeply challenging. In fact, outside of energy, most assets are down in 2022, just like in 2018:
Figure 6. Returns by Asset Class in 2022
Problems loading this infographic? - Please click here
Source: Blomberg; as of 9 December 2022.
An oncoming recession may kill inflationary momentum and allow the Fed to pivot and cut rates.
In our view, investors have a distinct choice. Inflation drives monetary policy, which drives returns. With high but falling inflation, one option is for investors to take a big directional bet. They can position their portfolios to exploit one of two hypotheses. Either an oncoming recession will kill inflationary momentum and allow the Fed to pivot and cut rates, which will support asset prices; or they can anticipate that inflation stays higher for longer, and the Fed will keep to its hawkish course. The former scenario is reminiscent of the Fed’s hiking cycle of 2018: bad news is good news, buy the dip and wait for the cavalry of accommodative monetary policy to ride to the rescue. The latter is a regift of what we have experienced in 2022. In our view, investors should short risk assets, especially high-multiple equities in sectors such as tech and ruinously expensive bonds, while being long the US dollar, and flexible in commodities while sticking with trend-following strategies.
Figure 7. Cross-Asset Correlation Quantiles - 4 November 2022
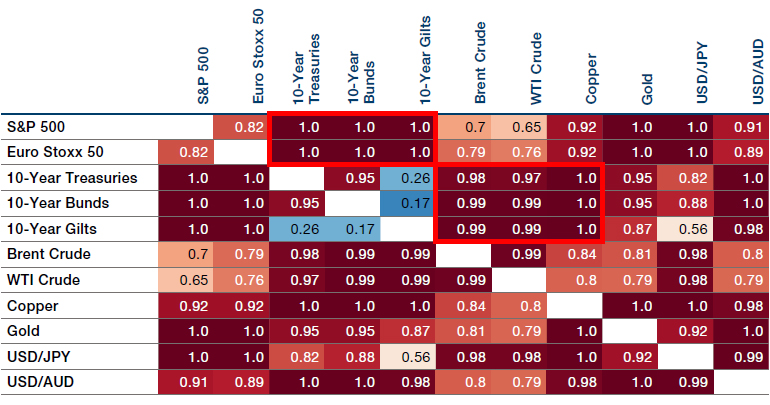
Source: Bloomberg; as of 1 December 2022.
To us, neither strategy is particularly appealing. 2022 reinforced the difficulty of accurately predicting inflation, and to repeat the same exercise in 2023 seems like folly. While some portfolio managers are constrained by their mandates, institutional investors and multi-asset managers have another option: managing correlations rather than taking a directional bet.
When managing volatility, investors need to target risk, not returns.
A key premise when managing correlations is to keep a keen eye on volatility. We note that for most risky assets, cross-asset correlations are highest when volatility is high. In our view then, it follows that by monitoring volatility, scaling exposures to reflect changing volatility is a safer course. Investors should target risk, not returns. By reducing gross exposures when volatility is high and cross-asset correlations spike, investors may be able to avoid a repeat of the sustained bloodbath that characterised 2022. Similarly, trend-following offers help in either case as it takes advantage of volatility and shifting regimes to generate returns and help investors better navigate 2023.
Quantitative Tightening and the Dangers of Poor Liquidity
A further concern is the effect of quantitative tightening (‘QT’) on financial conditions. As the Fed has begun to slow its purchases of US Treasuries, liquidity has simultaneously deteriorated (Figure 8). As we have seen across the Atlantic in the gilts market, when risk-free liquidity begins to disappear, we get serious trouble. In September, overleveraged UK pension funds were caught out by lack of liquidity and forced into a fire sale when gilt yields rose sharply as consequence.
Figure 8. Liquidity in US and UK Government Bond Markets Have Fallen Significantly in 2022
Problems loading this infographic? - Please click here
Source: Bloomberg, data illustrates liquidity conditions in government bond markets based on the GVLQUSD Index and GVLQGBP Index; as of 19 December 2022.
The real lesson lies in the self-reinforcing spiral. The fire sale in gilts was exacerbated by large allocations to illiquid investments in private equity, credit and real estate. Initially, sales were made in the most liquid holdings of credit, but soon as the supply of the liquid asset pools was exhausted investors moved into less liquid assets with some AAA securities being dumped at 9% yields. The consequence was that UK pension funds became far more tilted towards illiquid rather than liquid assets, ironically the least helpful outcome in a crisis. Headlines started appearing with investment banks and private equity firms bragging about buying assets at extraordinary discounts of up to 30% below fair value. When hard-pressed, pension funds finally had to sell the gilt hedges to their liabilities. Thus, having put on hedges at low levels of rates over the years, they were forced to sell them due to margin calls at the highest levels of rates seen in years, in effect adding short duration risk at the worst levels seen in 20 years.
Cash was king in 2022, and thus, perhaps, liquidity will be king in 2023.
In the aftermath of this reckoning for the industry, there is no sign that liquidity is improving. As seen recently, gates are being put up on real estate and credit funds to prevent investors rushing for the exits. Falling liquidity may therefore have two effects in 2023. Illiquid strategies may well see much lower inflows. The illusory safety of private equity may never go away, but no one has any misconception about the liquidity of these assets. Cash was king in 2022, and thus, perhaps, liquidity will be king in 2023.
Investors may, instead, direct investments into liquid alternatives as they provide the necessary diversification, low correlation and positive returns, without endangering the portfolio during times of crisis. Liquid alternatives had outflows in the UK during Q3, 2022, but unlike most UK assets, did not suffer severe markdowns and managed to return cash to investors as promised.
One last victim of the UK crisis: investor’s assumptions. While everyone claimed to know that rates could rise, the backtests and margin liquidity assumptions seemed to be based on these sort of moves happening slowly. Liquidity in the liquid assets held was assumed to be enormous and thus could sustain any need to move assets around to meet margin calls.
King Dollar and the Risks to the Upside and Downside
Another outworking of the inflation-inspired Groundhog Day is the relationship between the US dollar and non-dollar denominated assets. With the Fed ahead of other central banks, hiking faster and further, the dollar has risen sharply (Figure 9).
Figure 9. US Dollar Index
Problems loading this infographic? - Please click here
Source: Bloomberg; as of 9 December 2022.
If the Fed pivots, other central banks may be bailed out, not least the Bank of Japan .
The challenge of managing dollar exposures is unlikely to disappear in 2023. It is worth pointing out that we may be at or close to top when it comes to dollar strength. If the Fed’s hiking cycle is nearing its end, the spread between US interest rates and global rates – in particular the yen, the euro, and sterling – may start to decline. This will disincentivise carry traders and reduce the upward pressure on the dollar. Already, currency markets have begun this repricing late in 2022. Furthermore, if the Fed pivots, other central banks may be bailed out, not least the Bank of Japan (‘BoJ’) whose efforts to keep control of its yield curve may wind up precariously close to coming unstuck. Yields on maturities of Japanese Government Bonds (‘JGBs’) selected for purchase by the BoJ are already out of step with the rest of the curve (Figure 10). If further rate hikes from the Fed keep the carry trade going, it is very likely that yield curve control will collapse, forcing the entire JGB curve higher and possibly prompting defensive and potentially recession-inducing hikes from the BoJ.
Figure 10. JGB Yield Curve
Problems loading this infographic? - Please click here
Source: Bloomberg; as of 12 December 2022.
Hedging non-dollar investments has been exceptionally tricky this year.
In the meantime, investors must contend with the effects of a strong dollar on portfolios. Assuming the dollar as the portfolio currency, hedging non-dollar investments has been exceptionally tricky this year. Even those positions up in local terms may well be down when converted back into USD. It begs the question of whether investors can take a pro-risk stance in local currency, if the hedging picture remains uncertain. On the other hand, non-dollar-based investors buying US equities and credit have benefitted greatly from USD strength as they typically run underhedged for currency risks in their dollar assets due to the currency correlation effect. In short, a US unhedged investor in global equities has had a much tougher year than their foreign counterparts who own equities locally (with Nikkei, FTSE 100, and Eurostoxx 50 indices all up in local terms) and US investments in USD which has appreciated sharply.
In many ways, this is again a two-part decision. The first course is to continue to rely on dollar strength and accept that weakness is usually accompanied by risk assets rising. The second approach is to be active around dollar exposures. Much like portfolios rebalance bonds and equities on sharp moves (Strategic Rebalancing), perhaps FX exposures should have similar processes around them. Of course, all this overlooks that early in 2022, certain currencies like Australian dollar became correlated to commodities and thus, the USD hedge failed those investors until ultimately proving reliable during latter periods as hard landings began to be priced in.
Trend-following once more offers something of an alternative to these questions.
Trend-following once more offers something of an alternative to these questions. For US investors, by taking trend-following positions scaled to match the size of existing non-dollar investments, they should be able to offset fluctuations in the currency market – and live or die by their fundamental analysis rather than macro factors. In the same way, investors from countries with pro-cyclical currencies could apply trend to in a similar way to rebalancing portfolios or to override USD core holdings when their home currencies exhibit changing correlations.
Shocking: Energy and the CPI Basket
No discussion of inflation and the US dollar would be complete without considering where energy prices may go from here. We still face a structural energy shortage this winter, particularly in Europe (Figure 11). New supply is limited, and Western nations have struggled to diversify away their reliance on Russian gas. The prospect of severe energy shortages and rising prices remains very real especially as the US crude reserve has been heavily drawn down already.
Figure 11. Crude Oil
Problems loading this infographic? - Please click here
Source: Bloomberg; as of 12 December 2022.
If we are to experience a further energy shock, it is worth considering the mechanism by which this will affect the global economy. Energy comprises roughly a third of the CPI basket in most nations. Heating, along with food, is very much a non-discretionary item, which limits the ability of central banks to control price inflation. If faced with rising food or heating prices, consumers will simply spend more in order to live. This is not the same as the remainder of the basket, where a strict monetarist approach can go a long way to disincentivising consumer spending and take the heat out of an inflationary spiral. Instead, rising food and energy prices will force consumers to cease spending on non-essentials, rapidly reducing demand. In turn, this may well leave us with inventory overhang, cratering corporate margins at a time when few companies can afford lower earnings.
The threat of a further energy shock seriously compromises the relatively optimistic outlook that many still seem to hold.
As such, the threat of a further energy shock seriously compromises the relatively optimistic outlook that many still seem to hold. While it seems that consensus expects growth to stall in Q1 2023, with a simultaneous equity selloff, most 2023 outlooks also expect recovery to begin by Q3. We find it hard to justify this optimism: further deterioration and rate hikes are largely priced in. It therefore follows that it would take something like an energy shock to drive further selloffs – and if so, it is hard to imagine that the resulting problems are flushed out of the system by Q3. Investors may need a dose of clear-eyed realism – if the situation does get any worse, there a good reasons it may become a full-blown crisis rather than simply a brief recession.
The Death of the Crypto Salesmen? Bitcoin, Liquidity and Correlation
Another asset class to suffer during 2022 was undoubtedly cryptocurrency (see Figure 2). We would make two observations about crypto in 2023. The first is the Promethean aspect of the crypto bubble. Unlike other financial bubbles, crypto has repeatedly burst and reinflated, an observation we first made in 2021. While boom and bust may be hard on retail investors, it does provide ample opportunity for quantitative Momentum traders and lots of enjoyment for readers of Matt Levine and FT Alphaville.
The second is the liquidity angle. Despite claims that bitcoin provided an alternative to the mainstream financial system, when markets sold off, cryptocurrencies sold off right alongside. If we are to experience continued tightening, with liquidity shrinking across both bonds and equities, it is likely that we will see further cryptocurrency selloffs. The high correlation of bitcoin to other assets this year may well indicate (whisper it) that sky high prices were another symptom of wider speculative excess triggered by over easy monetary policy. Just as the crypto enthusiasts rode high when times were good, QT and a general squeeze of the retail investors may sharply withdraw the conditions needed for a Promethean recovery. While opportunities will abound for Momentum traders and those discretionary managers with the nose for fraud, investors should likely treat cryptocurrency how it deserves: a sentiment-driven risk asset.
Investors may wish to focus on managing correlations, keep liquidity levels high, and avoid large directional bets.
Conclusion
Investors appear to be expecting that 2023 may be bumpy. But it feels as if they are unwilling to accept the logical conclusions of their analysis. many investors expecting a Fed pivot may find it akin to waiting for Godot; there are still many factors which could keep inflation high and demand low, most notably energy shocks. With liquidity falling and correlations high, the chance of a financial crisis is the highest for a decade since the cavalry of supportive monetary policy is far less likely to come to the rescue. In place of the optimistic growth expectations seen across many outlooks we have read this holiday season, investors may wish to focus on managing correlations, keep liquidity levels high, and avoid large directional bets.
Inflation may come down. We may have a soft landing, and the Fed may execute its pivot successfully. But there are more than enough things that could go wrong in 2023. It is just a shame that they may remain the same things as last year.
You are now exiting our website
Please be aware that you are now exiting the Man Institute | Man Group website. Links to our social media pages are provided only as a reference and courtesy to our users. Man Institute | Man Group has no control over such pages, does not recommend or endorse any opinions or non-Man Institute | Man Group related information or content of such sites and makes no warranties as to their content. Man Institute | Man Group assumes no liability for non Man Institute | Man Group related information contained in social media pages. Please note that the social media sites may have different terms of use, privacy and/or security policy from Man Institute | Man Group.