The focus of passive managers on cost efficiency comes at a price. The time may be ripe for active managers to strike back.
The focus of passive managers on cost efficiency comes at a price. The time may be ripe for active managers to strike back.
April 2018
Historically, it tends to take a while before the unanticipated consequences of any new market phenomenon come clearly into view. The exponential growth of ETFs and other passive investment vehicles over the past few years has had a profound impact on the functioning of markets, and particularly on the behavior of equity indices. Last month, we wrote about the incomplete picture that these indices paint of the markets they purport to represent. We now want to delve a little deeper into the impact of the precipitous rise of passive investing on indices and their component securities.
We are currently seeing inflows into passive investment funds that are, if not quite unprecedented (ETFs still make up a smaller share of the US market than they did in 2007, although the absolute value of investment is higher now), then certainly remarkable. Investors allocated a massive USD692 billion into passive funds and ETFs last year, compared to USD45 billion in outflows for active funds, according to Bloomberg. A recent EY survey predicted that assets in passive investment funds would exceed active funds in the next 10 years. It also suggested that the ETF market would grow to USD7.6 trillion by the end of 2020 from just under USD5 trillion currently. Figure 1 illustrates the scale of the secular shift from active to passive management that has taken place over the past decade.
Figure 1. Passive flows dwarf active
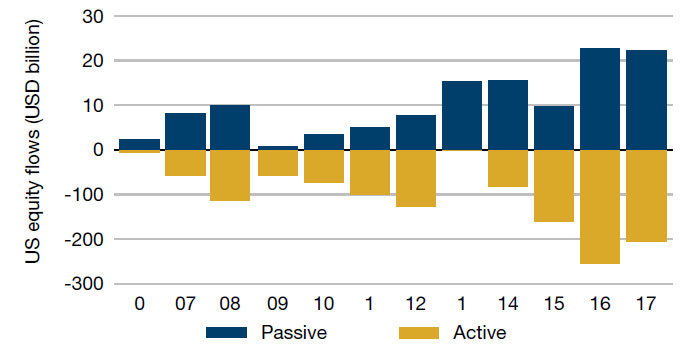
Source: Morningstar Direct Asset Flows.
According to a survey of its members conducted by the Index Industry Association, there are now 3.28 million indices being regularly updated for asset management clients. The World Bank reports there are 43,192 public companies (Figure 2). Where indices were once a useful way of grouping together the stocks of a particular market, region, or sector, they have now become so prevalent and in demand that the scale of investment in indices represents a substantial portion of overall equity market investment. Seven of the 10 most actively traded securities on US stock markets last year were ETFs, while SPY, the USD254 billion ETF that tracks the S&P 500, was by value the most traded share.
Figure 2. Manufactured indices exceed the number of publicly traded companies
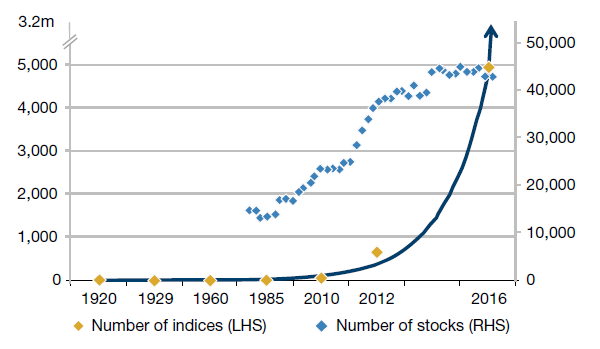
Source: Wurgler (2011), ERI Scientific Beta, World Bank and Bernstein analysis. For the number of indices, the first five datapoints are based on Wurgler (2011) “On the Economic Consequences of Index-Linked Investing”. The last two datapoints refer to the cumulative number of factor indices (4,274 from ERI Scientific Beta) and 673 ETFs identified by Morningstar. Bernstein fitted an exponential curve. It left the scale on the X-axis non-linear on purpose as, in fact, the recent rate of index creation exceeds that fitted by an exponential curve. S&P’s claim of a million indices spans all asset classes: of that it says 850,000 are equity indices. The overall figure of 3.28 million indices is from the Index Association Alliance.
While the benefits to investors of the move to passive investment, in terms of lower fees, are obvious, the potential costs are less immediately clear. Sanford C. Bernstein’s team of analysts, which in 2016, labeled passive investing ‘worse than Marxism’, recently pointed out that there really is no such thing as passive investment. Even supposedly passive investment requires active decisions to be made, either by humans or machines. And at each stage of the decision-making process, whether we’re talking about substitutions within an index or the loss of investor agency when it comes to voting rights, the rise of passive investment has generated inefficiencies. The exclusive focus on the cost efficiency of following an index has ignored the opportunity cost of suboptimal investing and the distortions being caused in markets, and there are a host of people seeking to take remunerative advantage.
Let’s take as an example the inclusion of a stock within an index. When a company joins the S&P 500, then, on the day of inclusion, a wall of passive money will be forced to purchase the stock by the nature of the rules that govern the ETFs. This obviously works the same way for those companies who drop out of the index and are sold by index funds and ETFs. Traders have exploited the obvious arbitrage opportunities presented by this in the past, but the sheer size of the move to passive investment means that there is greater scope to potentially profit here than ever before.
This situation has led to some strange imbalances. One obvious case is the devaluation of the voting rights attached to stocks. The concentration of voting power in the hands of a relatively few large ETF issuers leads to a host of potential conflicts. Where once activist and other small shareholders would have been able to put pressure on management teams when it comes to the central decisions that impact share prices: corporate strategy, M&A policy, and dividend pay-outs, investors have now ceded these valuable benefits to organizations who may not have their best interests at heart. Passive funds are keen to talk up the work they do when it comes to things like board membership and executive compensation, but we believe that they are less willing to apply pressure on the issues that potentially have the most tangible impact on companies’ share prices. Already we have heard numerous anecdotes of firms acting with apparent impunity because the voices of smaller investors are drowned out by the more management-friendly passive behemoths.
It’s striking that the last time ETFs garnered such heightened investor interest was at the tail end of the previous bull market. In the final stages of a cycle, the market can be a tide that lifts all ships. At times of low volatility and low dispersion, passive investment can make sense, with a focus on cost reduction clearly of prime concern.
We are not calling the end of the bull run, but, as following graphs illustrate, in a more volatile market, active managers have potential to add value. These charts show that at times of market turmoil, such as we experienced at the end of January this year, active management has outperformed. Volatility is picking up and inflation and interest rates are rising. After several years of watching passive funds hoovering up investor money, we believe stock-pickers may now have a chance to prove their worth.
Figure 3. Stock-pickers strike back?
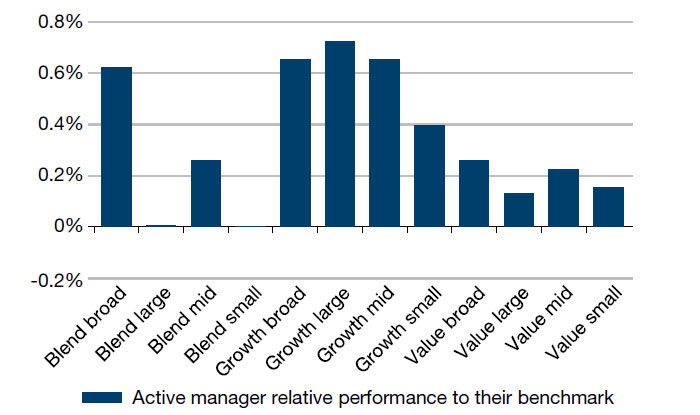
Source: Bloomberg and UBS. Date range: 29 Jan to 6 Feb 2018.
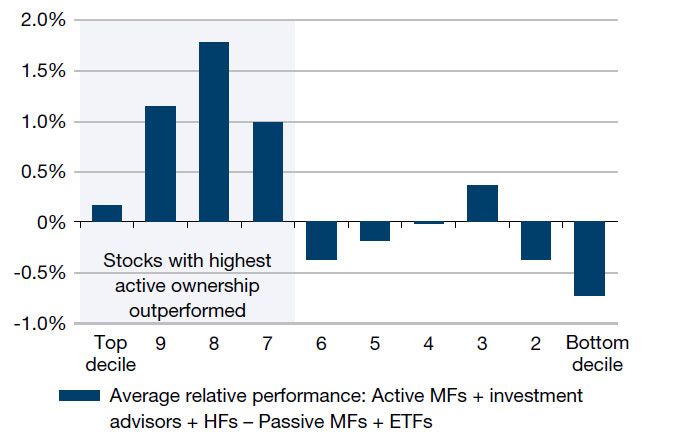
Source: FactSet and UBS.
You are now exiting our website
Please be aware that you are now exiting the Man Institute | Man Group website. Links to our social media pages are provided only as a reference and courtesy to our users. Man Institute | Man Group has no control over such pages, does not recommend or endorse any opinions or non-Man Institute | Man Group related information or content of such sites and makes no warranties as to their content. Man Institute | Man Group assumes no liability for non Man Institute | Man Group related information contained in social media pages. Please note that the social media sites may have different terms of use, privacy and/or security policy from Man Institute | Man Group.