Long resilience and short fragility may be the best opportunity to generate a positive return from future cycle volatility.
Long resilience and short fragility may be the best opportunity to generate a positive return from future cycle volatility.
March 2019
Introduction
In 2018, corporates had to deal with softer end-market demand, profit margins towards long-run highs, a number of non-linear political outcomes and, in many cases, exuberant market expectations. We believe it is not too surprising, then, that 36 companies in the UK market saw their share price more than halve during the year.1
Our job is to protect and grow our investors’ capital over time, regardless of the direction of markets. Thus, in years like 2018 – where the UK market fell almost 10% – a positive outcome is, in our view, only possible through a combination of profiting from those situations in our short book and avoiding them as much as possible in our long investments. Our understanding of fragility – and resilience – is crucial in this regard, and has been central to much debate on the desk over the year.
Unlike our process – that seeks to provide a numerical estimate of a company’s assets – the idea of resilience is a softer factor that goes into our decision-making process. The below is thus more of an explanation of our general thought process rather than a set of hard and fast rules or water-tight definitions.
We think of resilience as the ability of management to respond to a change in their external environment to the benefit of their equity shareholders. Fragility is the opposite; the inability to protect shareholders from negative events. We think of this across the three financial statements: profit and loss, balance sheet and cash flow.
Profit and Loss
Within the profit and loss (‘P&L’) account, we focus on operating margins. The level of operating margin largely dictates a company’s sensitivity to both cost inflation and movement in sales. Consequently, operating leverage is the biggest predictor of future profit volatility, in our view.
From a fragility perspective, we take particular note when margins are toward the top of what a company or industry has been able to achieve in past cycles. Clearly, margins are far from the only consideration in respect of a company’s profit resilience. Other factors – including pricing power, end-market growth and a low gross-to-net margin differential – are all also important. However, we use operating margins as a sensible starting heuristic: all else equal, low-margin companies tend to be more fragile.
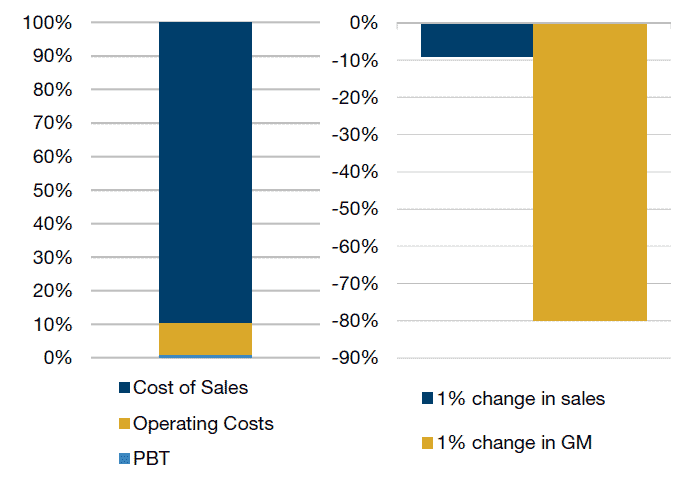
Let’s take a car retailer as an example. In the third quarter of 2018 (which historically tends to be a profitable period), it issued a profit warning, stating that the business would be break-even at a profit-before-tax (‘PBT’) level in the period. Did sales collapse? Did costs run out of control? Was there an accounting black hole? The answer to all these questions is a resounding ‘no’; revenue grew at 3.7% in the period, fixed costs inflated at no more than 4% and there was no meaningful accounting reset.
So, what caused this 100% downgrade to profits? Two seemingly innocuous things: the mix of sales (from new to used cars), combined with some gross margin pressure given a softer used end-market.
Figure 1. Car Retailer - Impact on PBT for a Change in Sales/Gross Margin (‘GM’)
Source: Bloomberg; as of 31 December 2018.
The company makes a gross margin of 11.5%, an EBIT (earnings before interest and tax) margin of 1.9% and a pre-tax margin of 1.3%. Consequently, such small moves in end-market dynamics can have a material impact on profitability. In our eyes, the company lacks resilience from a P&L perspective. Whilst this may not be enough to prevent a long investment (or even initiate a short one), it certainly contributes to our decision-making process.
Balance Sheet
Within the balance sheet, our focus is on who sits above the equity holder in the capital structure. Companies are resilient, in our minds, if there are few other calls on its assets and earnings. The most obvious of these is long-term debt, but we would also include leases, contingent liabilities, factoring facilities, pension deficits, negative working capital and deferred consideration. We also take into account non-recourse debt within joint ventures, believing strongly that joint ventures are there for a reason and so simply ‘letting them go’ because they are non-recourse may have a significant negative impact on the company’s shareholders.
Balance-sheet resilience is the financial statement that we look at most explicitly. We respect equity as a long-duration and volatile asset class. By making an investment, we are making a call on whether we believe the company we are investing in is a sustainably better business than it is being priced for today. Importantly, this is after taking into account paying back every other stakeholder above you in the capital structure. Simply put, we believe a business is resilient if there are few of those other stakeholders.
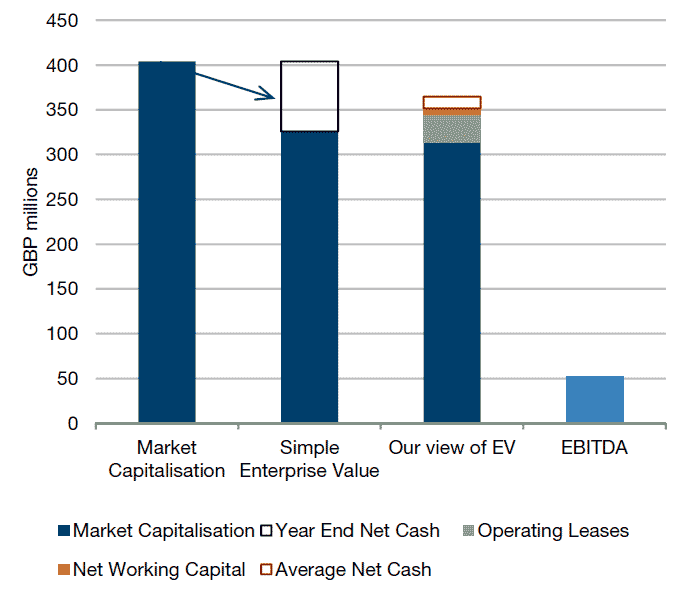
We believe two construction companies provide a good illustration of this point. Company A has a total negative working capital of GBP20 million and gross debt of GBP80 million against a gross cash pile of GBP160 million, which stays broadly flat over the year. Furthermore, there are no significant factoring, joint ventures or off-balance sheet liabilities. The largest elements of working capital are around contract work-in-receivables and deferred income in payables, which is the pass-through to subcontractors from their end customers, and broadly balances. Thus, we think this company exhibits balance-sheet resilience: the working-capital balance and gross debt is low, and the business is in a strong net cash position across the year. The cash pile can help absorb a shock to working capital (i.e. receivables collection drops to 70% and the payables are all paid in the next period) and the cash generation could sustain the resulting level of gross/net debt across the year at 1.5x cashflow.
Figure 2. Company A’s Enterprise Value – Long Position
Source: Bloomberg; as of 31 December 2018.
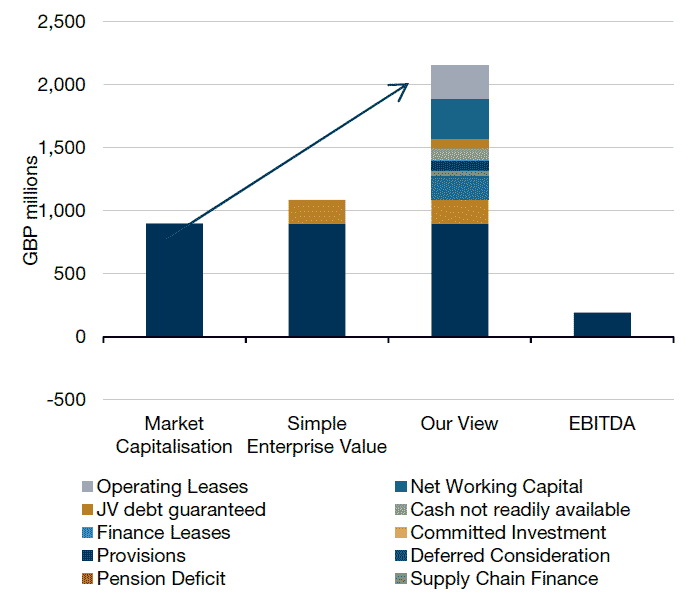
Company B is a very different story. Despite facing into a similar end-market to Company A, its balance-sheet leverage is far higher. Average net debt is GBP190 million higher than reported year-end debt, with GBP600 million of gross debt. In addition, there is more than GBP300 million of working capital-related liabilities in its residential and property businesses, supply chain finance, a pension deficit, numerous provisions and a further negative working capital balance, which is particularly costly in a low-margin business. Against this pile of liabilities, from an asset perspective, the company has a large amount of goodwill from historical deals, some work-in-progress and their portion of assets sat within joint ventures (which are becoming increasingly leveraged). The company has also made loans to the joint ventures themselves, potentially compounding leverage.
Figure 3. Company B’s Enterprise Value: Affected by a Weaker Balance Sheet
Source: Bloomberg; as of 31 December 2018.
Overall, we believe Company B has a very fragile balance sheet. Indeed, negative working capital stands at 14% of sales or over 2x adjusted annual profits, leverage stands at 4x annual profits once factoring is taken into account and there are very little realisable tangible assets to offset this. Any profit shock or cash shock around working capital could put equity holders at significant risk.
Our choice of examples here is instructive. We are absolutely not of the view that construction companies are a bad investment. Instead, we take each individual company on its own merit through the lens of our process. Thus, Company A could be a long position and Company B could be a short despite both of them facing into the same end markets.
Again, there is no hard and fast set of rules when we consider balance-sheet fragility. In distressed companies, we might concentrate more on working capital and short-term cash availability. In some asset heavy businesses, we will spend more time looking at the value-at-sale of their tangible assets. In all cases though, it is the nature, size and immediacy of the liabilities that informs our view of whether a company has a resilient, or fragile, balance sheet.
Cash Flow
Here, we view resilience as a combination of low free cash flow (‘FCF’) volatility and high conversion from earnings.
By volatility, we mean the propensity for the cash flow of the business to change unexpectedly by a large amount against expectations. Things that drive high cash-flow volatility (and thus low resilience) can be low operating margins, high leverage, large working capital balances, significant use of off-balance sheet liabilities, high capital turn, volatile capital expenditures (‘capex’) requirements or a rapidly growing balance sheet. Low volatility is a positive for balance-sheet resilience as we believe it adds to the predictability of returns in future periods. Cash flow is particularly crucial, as cash generated not only determines our return calculations within return on invested capital (‘ROIC’) – and thus the multiple of tangible assets we are prepared to pay for a business – but also drives down the price we are paying for a company by lowering the enterprise value (‘EV’); equitizing the EV.
By conversion, we mean the amount of a company’s headline net income that ends up reducing debt or getting paid out as dividends after normalising working capital practices. Thus, we take into account the level of capex, any pension payments, cash outflows to meet provisions or pay out contingent liabilities, deferred consideration payments, exceptionals, cash movements from joint ventures, asset sales and movements in the different aspects of working capital.
We view high cash-flow conversion as important to resilience because it can both lower volatility and increase the likelihood that any P&L valuations (primarily the market’s focus) marry up with our cash valuation. Finally, it gives management options: to pay out more as dividends; to invest more in capital spending or fund acquisitions; invest in working capital to grow the business; or simply survive a more challenging environment, as they can absorb lower cash profitability without becoming cash consumptive. As an aside, this is one of the reasons companies that do large deals tend to be particularly at risk in the immediate period after completion. In our view, not only is their balance sheet often stretched, but also the level of exceptionals typically involved to realise synergies lowers cash conversion, making both the balance sheet and cash flow fragile.
Typically, the cash-flow volatility consideration is rooted in the business model of a company and thus tends not to change enormously over time in our view. The cash-flow conversion, although in some cases structural within a business, is often a shorter-term consideration based on the next year or two ahead and can more easily change. Again, an example here is helpful.
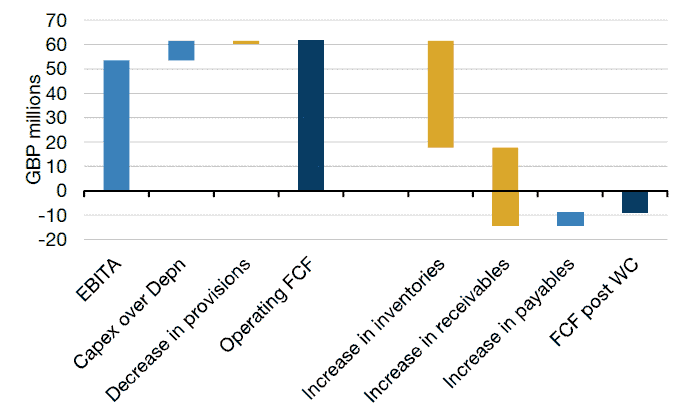
Take two suppliers in the oil and gas sector. Supplier C, we believe, has a high degree of cash-flow resilience. From a volatility perspective, analysts project it to make an EBITDA margin of more than 16% this year, with almost half of the business at around break-even on very minimal levels of revenue (leaving more potential of an upside rather than downside surprise). There is no debt, working capital liabilities are sub-1x earnings and there is minimal capex requirement on well-invested assets.
In our view, there are a number of reasons it exhibits resilience from a conversion perspective. First, there are no material cash exceptionals. Secondly, there is little cash tax to be paid for a number of years given historical losses. Thirdly, capex can sit below depreciation for the medium term due to heavy investment at the top of the previous cycle, which has resulted in current assets being under-utilised. Finally, although inventory is growing as the business recovers, there is no stretch in receivables or payables that needs to unwind and no change to days of sales outstanding. Thus, we believe there is reason to believe that cash generated could be higher than 100% of net income for this company.
Figure 4. Company C’s Cash Conversion
Source: Bloomberg; as of 31 December 2018.
Its peer – Company D – exhibits a high degree of cash-flow fragility, in our view. From a volatility perspective, it has low operating margins (c5% in 2018), a large working capital balance (>6x EBITDA), working capital factoring, significant on- and off- balance sheet liabilities (headline gross debt of 5x EBITDA excluding any debt sat within joint ventures) and a high on-going interest cost creating the potential for significant future volatility in cash-flow.
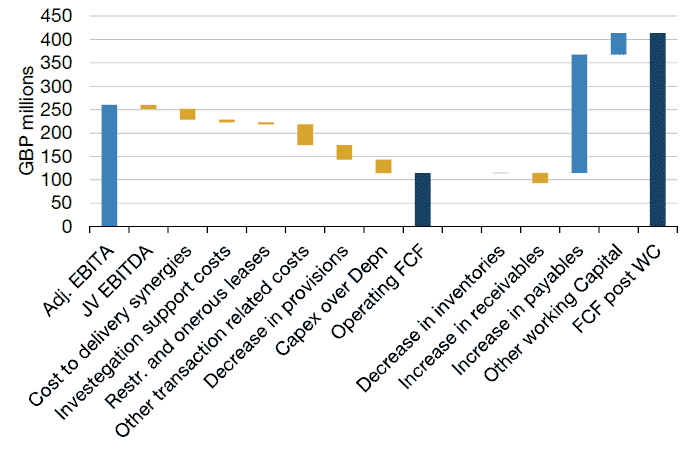
From a conversion perspective, it also measures poorly. There are a litany of line items between ‘adjusted EBITDA’ and the underlying cash earnings. In the last announcement, there were: costs to deliver synergies, onerous leases, transaction-related costs, investigation support costs and restructuring and other charges. Interestingly, this is being paid for by their supply chain and thus isn’t reflected in headline net debt metrics: the company has markedly increased payables over the period with USD253 million of the USD339 million of total operating cash generated in the first half of 2018 coming from the increase in payables alone. We would question whether this was sustainable, as recent capital raisings in support services and construction have shown.
Furthermore, this company has a number of provision buckets for historical environmental litigations and an ongoing set of contingent liabilities ranging from alleged historical malpractice to separate regulatory investigations on either side of the Atlantic. All of this could result in an unspecified, potentially large, cash call in the future from an already weak cash flow. Taken together, this level of cash-flow volatility and poor conversion from earnings result in a high level of cash-flow fragility, in our view.
Figure 5. Company D Cash Conversion
Source: Bloomberg; as of 31 December 2018.
Bringing It Together
Why should one care so much about fragility and resilience? Being determinists, hugely sceptical of anyone’s ability to predict the future, and also believing that the market ineffectively values the potential for significant change in a company over time, leads to a seeming contradiction: how do you exploit the inefficiency if one is so sceptical about the ability to predict what is going to happen?
Our answer to this contradiction is not to predict necessarily how the future will change, but simply acknowledging that there will be change. Resilience and fragility play a big part. If you can fill the long book with companies you believe are great value and resilient, and short companies you believe to be expensive or over-earning and fragile, then our opinion is that you give yourself the best possible opportunity to generate a positive return from future cycle volatility.
For a significant number of companies, resilience or fragility exists across more than one of the financial statements. Companies with a large amount of debt might also have poor cash conversion, or companies with high operating margins might also convert all their earnings to cash. Where we can find resilience across the financial statements, and key valuation criteria are met, there may be a compelling long opportunity.
There is much more we can do in improving our understanding of these themes and extending them beyond the financial statements. Could we, for example, take it from company fundamentals to shares in the market? Here, fragility would be based on a best-case outcome already in earnings expectations combined with every analyst bullish. Thus, anything but a fantastic outcome would be a disappointment. Furthermore, we must consider the risks with such a focus on fragility, the biggest of which, we believe, could occur when coming out of an economic downturn. At that moment, highly leveraged, low-margin businesses have historically benefited the most from an improving end-market environment. Thus, what we see as a fragile short book could rise more quickly than our resilient long book.
The value of investments and the income from them may rise as well as fall and investors may not get back the amount originally invested.
1. Source: Bloomberg; as of 31 December 2018.
You are now exiting our website
Please be aware that you are now exiting the Man Institute | Man Group website. Links to our social media pages are provided only as a reference and courtesy to our users. Man Institute | Man Group has no control over such pages, does not recommend or endorse any opinions or non-Man Institute | Man Group related information or content of such sites and makes no warranties as to their content. Man Institute | Man Group assumes no liability for non Man Institute | Man Group related information contained in social media pages. Please note that the social media sites may have different terms of use, privacy and/or security policy from Man Institute | Man Group.