How we’re turning off-the-shelf ESG data into useful and informative signals.
How we’re turning off-the-shelf ESG data into useful and informative signals.
March 2019
Introduction
Data quality is of utmost importance to any quantitative investment process; no matter how good a model is, it will be doomed if it is fed with poor quality data.
Environmental, social and governance (‘ESG’) data have matured over the last decade, and we are entering a phase where the data have both a long-enough history and broad-enough coverage to make it interesting to quantitative investment firms. However, unlike traditional quantitative factors sourced from financial statements and exchange data, ESG statistics are often qualitative, discretionary and unregulated. Indeed, the ESG data we obtained by vendors typically has a short history and is often retroactively collected. Hence, the challenge for a quantitative manager is how to convert this unstructured data into useful insights.
This white paper reviews the biases inherent in some of the data and why we believe taking the vendor-provided ESG data at face value can be misleading. We believe that by investing the time to understand the nuances of each vendor’s methodology and properly handling their data quirks, we can potentially build a unique, alpha-generating data set. In our view, only through understanding what each data item is trying to measure and applying the right quantitative tools in the right places can we gain relevant insights that help us reach our goal of identifying long-term ESG investing prospects.
Lessons from Data Exploration
Man Numeric’s journey into ESG data began with vendor selection and ended with the capability to integrate a multi-vendor view of ESG directly into applicable portfolios. Along the way, after countless hours, we have learned a few valuable lessons. At a high level, we believe material factors one should consider when using ESG data include:
- Breadth of Data Vendors: Data creation in ESG is an evolving space. Traditional vendors are constantly changing their standards on what is relevant, while new entrants can take a completely orthogonal framework to construct their metrics. As such, it is common to see the definition and coverage of ESG factors changing over time. An effort to increase the breadth of coverage has led to some vendor consolidation and the wide variety of different data delivery mechanisms.
- No Consensus: Data vendors view the importance of ESG factors differently. Some vendors focus on a company’s ESG policies, others focus on compliance and still others on ESG incidents. The correlation between ESG scores across vendors is low. Due to the low counts in some industry specific ESG data, stock-level ESG scores can often change due to adjustments within the industry, rather than any material change in the ESG outlook of a company itself.
- Regional & Sector Differences: Given the variety of ESG regulations across regions and sectors, blindly comparing two companies’ high-level scores is like comparing apples to oranges.
- Unique Distributions: The lack of standardization of factors and measurement criteria, and infrequent ESG data updates, creates challenges for researchers seeking to combine factors across vendors.
- Unintended Bias: Non-neutral common factor exposures (e.g., size, value, quality) are typically observed in raw ESG data. How do we determine if this is information or unintended baggage?
We address each of these issues to move from a fairly unstructured vendor-level treatment of ESG metrics to a more holistic, multi-vendor approach that we feel provides a better lens into the level of responsibility within each company takes as it relates to ESG.
Breadth of Data Vendors: Start with Quality Ingredients
Our recent efforts to understand ESG data began with cataloging the characteristics of data providers that have emerged as leaders in data delivery and adoption. There are now hundreds of ESG data vendors. Naively blending all their data together will fail to produce meaningful insights, in our view.
Instead, we reviewed more than a dozen ESG data providers and trialed eight of them to test in our rigorous quantitative framework. Our key criteria was how well each could be used in a quantitative investment process and which data sets complement each other well. By keeping the number of providers small, we were able to gain a deep understanding of each individual data set. This was preferable, in our view, to a shallow understanding of a larger number of providers.
Of key concerns to the research process are the quality, detail and coverage of data. A high-quality process is one with little collection bias (i.e., point-in-time data is available), transparency in score construction and a mature delivery process capable of providing data in a timely manner. Detailed data are of importance as it allows researchers to understand the characteristics contributing to score calculation and study the distribution effects of the data. Finally, data coverage as measured by the depth and breadth of data are important to ensure that there is ample history to study and that the data set covers a reasonable portion of our investable universe. The acquisition of vendors by competitors has also caused data challenges, with legacy scoring systems creating data quality differences within a single vendor.
Our observation was that while some data vendors are successfully tackling the quantitative requirements of data quality, the transparency of data and the ability to deliver a research-ready data-set are still a challenge for many providers.
No Consensus: Everyone’s Recipe is Different
How do you evaluate the ESG qualities of a firm? Since there are no standardized categories, each vendor develops their own methodology. While there is some agreement on the factors that comprise each category, the vendor determines both the number of factors, and their scale and distribution. Take, for example, two of the more well-known ESG data providers: Sustainalytics and MSCI (Figure 1).
The Sustainalytics ESG method analyses 139 factors focused on the quality and transparency of company disclosures. Standalone category scores (E/S/G) and a composite ESG score are created using a subjective weighting scheme applied to the raw data. As an example of the level of granularity, ‘incidents’ forms a formal factor category in each of the E/S/G pillars. Quantitatively, these data are interesting because of the ease with which one can access the raw data to determine the number of incidents, level of incidents, and the importance Sustainalytics places on the incidents category for a particular company.
MSCI has created a similar, but more qualitative, approach, which relies on its industry-focused ESG teams to weight the underlying factors. ‘Incidents’, rather than being a directly exposed factor, are part of the analyst’s subjective score calculation that balances an incident with a company’s ESG exposure and the company’s policies. This approach is more difficult to include objectively in a quantitative process.
Figure 1. Vendor Summary
| Sustainalytics | MSCI | |
|---|---|---|
| Data Collection Process |
200 Analysts 139 Factors Scores on 1-100 raw basis |
185 Analysts 37 Items, with 950 sub-factors Scores on 1-10 Industry-Adjusted |
| Factors by Pillar |
Environment 52 Social 52 Governance 35 |
Environment 13 Social 15 Governance 9 |
| Focus |
Heavy focus on disclosure and transparency Translation of discretionary data to categorical score Raw data with many outliers |
Emphasis on company’s ESG exposure / corresponding management policy Industry-focused ESG team to understand the risk exposure of each industry Review and get feedback from company Normalized data |
Source: Sustainalytics and MSCI.
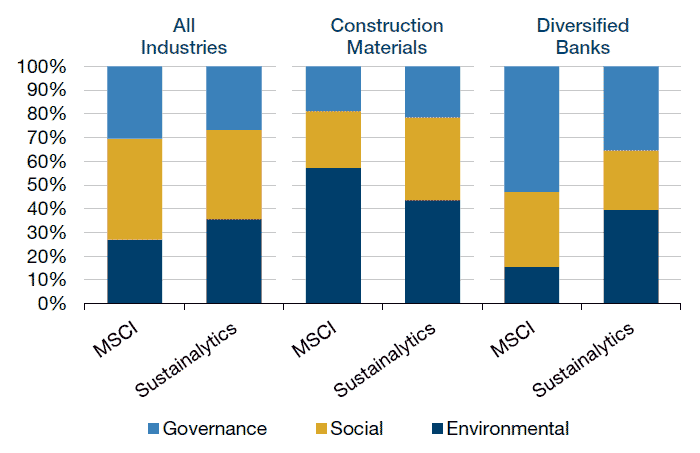
Further differentiating the vendors are how they weight individual factors (Figure 2). Sustainalytics tends to place roughly equal weight on each of the E/S/G pillars while the MSCI data team has a higher level of factor weight variance across industry classifications. This can result in material vendor differences at the industry level.
Figure 2. Sector Weights by Vendor
Source: MSCI and Sustainalytics; as of 30 September 2018.
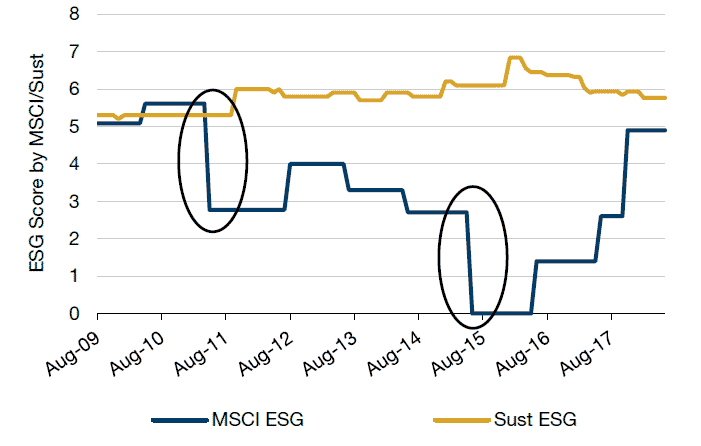
We looked at an example of ESG scores over time for an individual company (Figure 3). Sustainalytics thinks this US industrial firm is an above-average ESG-rated firm, while MSCI’s ESG score for this company had been trending downward from 2011 to 2015. One interesting observation was that for MSCI, the individual E/S/G components did not materially change during the period when the composite score was falling. So, what was driving the major industrial firm to score so poorly according to MSCI? Further observation revealed that the drop was due to the industry-adjustment that MSCI performs.
Consequently, some changes in ESG score are not due to the company-specific behavior, but rather due to changes in other companies within the industry. This secondary effect makes blending data challenging: one vendor’s data may be raw, while another’s may industry-adjusted score. Hence, combining data that is on a different basis may not be appropriate.
Figure 3. Case Study – US Industrial Firm
Source: Sustainalytics and MSCI.
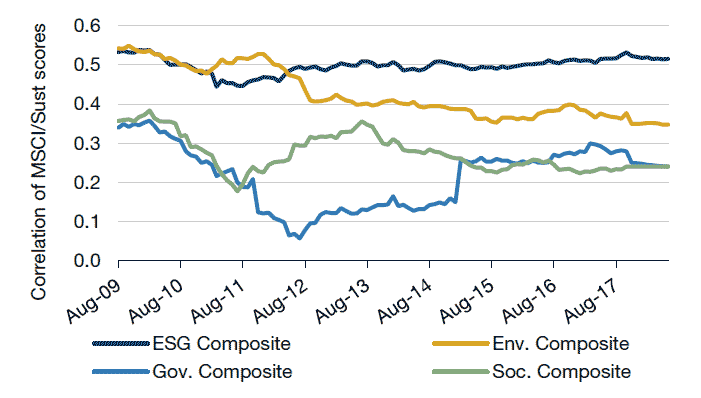
Our hope going in to this exercise was that there would be agreement amongst the vendors on a company’s ESG ranking. Unfortunately, what we observed is that correlations of ESG scores across vendors are low (Figure 4).
Figure 4. Correlation of MSCI and Sustainalytics Scores
Source: Sustainalytics and MSCI.
The overall correlation between MSCI and Sustainalytics averages approximately 0.5. Interestingly, the correlation is lowest for the governance composite. This was surprising since governance contains some of the more objective data like the number of independent directors and if the chairman and CEO are independent. Based on the subjective nature of some ESG data, our approach is to use the data vendors in the same way that we use analyst opinions, which is to blend those subjective opinions in to a single score. We believe that this could help distill the most important information to the tails of the distribution where there is consensus.
However, it is important to recognize that the ESG vendor differences do not invalidate each other, but rather demonstrate that they are measuring different components of a particular item. Like with sell-side research reports, sometimes the most rewarding insights derive from comparing two analysts with drastically different recommendations. If we consider Sustainalytics’s focus on disclosure and transparency, and MSCI’s focus on exposures by industry, we can start to see how the pieces fit together in the bigger ESG puzzle.
Regional and Sector Differences: Avoiding Unfair Comparisons
Most investors live in a relative world. It is important to look at similar companies when comparing the valuations or growth prospects of a given company. Comparing a utility company to a biotech company is not relevant. We feel it is important to put a company’s ESG score in the context of peer companies. This raises some interesting questions:
- If technology companies are, on average, more environmentally aware, do we want to punish ‘less’ green technology companies relative to their peers?
- There are high fixed costs to ESG. Large oil companies often have a higher ESG reporting score than many small green tech firms because they have the infrastructure to disclose detailed ESG data and smaller firms do not. Does this make an oil major ‘more green’ than a small biofuel manufacturer?
In certain jurisdictions, ESG scores are going to change due to non-company-specific actions. Instead, driven by increased pressure applied by various constituents within those regions, companies are now required to disclose more information. This type of difference is already manifested in regional score differences. As data analysts, we need to ask ourselves if regulatory requirements are driving the score differences or if a company is inherently changing (Figure 5), especially across regions. Europe, generally seen as at the forefront of ESG adoption, has the highest ratings across each of the ESG metrics. In contrast, Japan is in the middle of the pack for overall ESG, with a combination of a high E score (strong environmental controls) offset by a low G score (driven by board composition and corporate structure).
Figure 5. ESG Scores by Popular Benchmarks
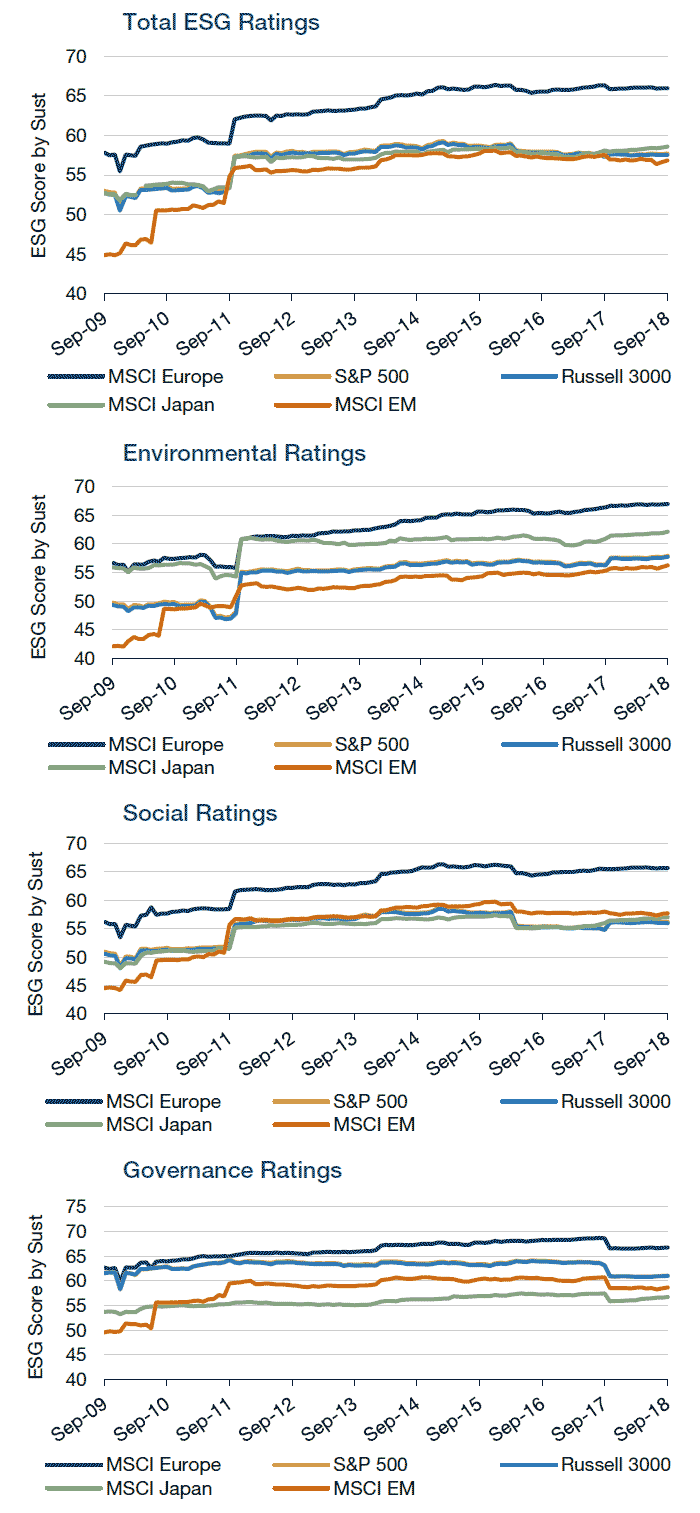
Source: Sustainalytics and MSCI. Regional differences in cap-weighted ratings affected by regulatory requirements.
Further bias can occur in data collection; as vendors have rolled out data, the priority has been on collecting data for the largest benchmark constituents.
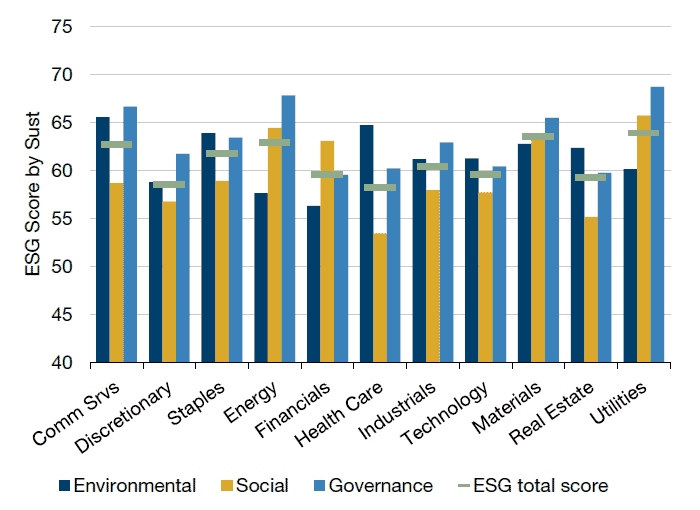
There is a similar counterintuitive story at the sector level (Figure 6). Across Sustainalytics’s sectors, energy and utilities have the highest overall ESG scores. This results from very different E/S/G component scores. Those two sectors have a higher governance score and lower environmental score on average relative to health care. Higher disclosure requirements and the regulatory environment in the energy and utility sector forces a transparency that improves a governance score, despite the fact that providing electricity can easily make a company’s environmental footprint look worse than a biotech firm that focuses on running research experiments in a laboratory.
Figure 6. ESG Score by Sector (MSCI World Index)
Source: Sustainalytics and MSCI; 30 June 2018 snapshot.
Is this a fair comparison that accurately reflects the sustainability of health care versus utilities? Would health-care firms have just as high a governance score if they adopted the utilities sector’s stringent disclosure and oversight requirements?
These issues make it imperative that we handle industry and sector differences carefully so we are not misled when making cross-sectional comparisons. At the same time, naively industry-adjusting every single comparison can mean throwing out important information. The key, we have found, is to understand why the differences are present between regions and sectors, and to try to handle them appropriately at the right level.
Strange Distributions: Raw Data doesn't Play Nice
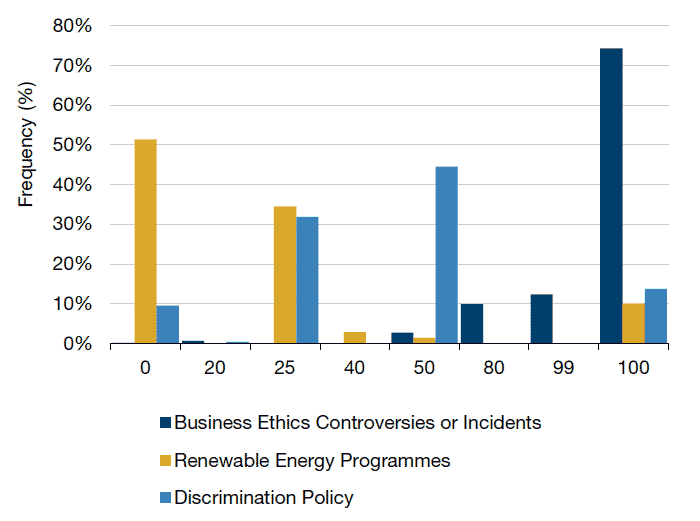
When dealing with data that are binary or highly event-driven, the nature of the data distribution comes into play. While MSCI combines the data in a way that results in a largely normal distribution, raw Sustainalytics data often have a skewed distribution. Combining a skewed distribution with a normal distribution does not result in a distribution that fits well into a time series or cross-sectional framework (Figure 7). The data distribution typically follows one of four cases; heavy one-side bias, tail-based, continuous and limited information (Figure 7).
- In the first case, ‘Business Ethics Controversies or Incidents’ are infrequent, but highly newsworthy and provide an example of a heavily skewed distribution. Sustainalytics makes a clear distinction between 100 and 99, but there is little difference from a statistical point of view in the 0-100 scale;
- Tail-based distributions (0 or 100) like ‘Renewable Energy Programs’ can be a result of a mostly binary scoring mechanism;
- Continuous distributions like ‘Discrimination Policy’ are the easiest to use;
- Finally, cases where the meaning of data values are imprecise come into play. Vendors can use zero scores to mean different things. Sometimes a zero means that the company scores poorly on that given metric. Other times, a zero means that the vendor has deemed that variable irrelevant for that stock’s industry. If evaluating a company’s Renewable Energy Program (Figure 7), it would be important to know if that company has the worst program of the companies being evaluated or if the factor is not relevant to that industry. You would not be able to make that determination using the off-the-shelf data.
We also have to make the decision between forcing a normal distribution and losing very valuable information from a binary variable. While it is tempting to force a normal distribution for easier processing, like with regional and sector differences, we can risk losing some signal and allowing more noise. We have found a way to achieve both goals potentially: keep the relevant information and make the data easy to process and combine.
Evaluating each of these cases and combining the data into a meaningful signal are challenging but essential parts of extracting usable information.
Figure 7. ESG Score Distributions
Source: Sustainalytics; 30 June 2018 snapshot.
Unintended Biases: Exposures Beyond Sector and Region
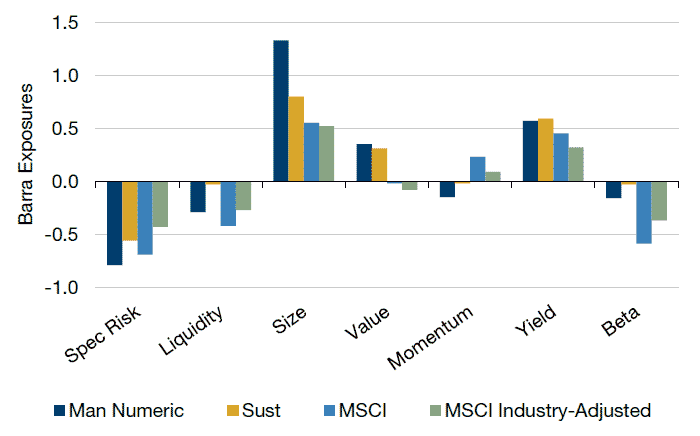
ESG data typically accompany other common factor exposures (e.g., size, value) (Figure 8.) How do we determine if this is critical information or unintended baggage?
Figure 8. ESG Barra Exposures
Source: Sustainalytics, MSCI, and Barra; as of 30 June 2018.
Neutralizing to these risk exposures, especially since they tend to be static risk exposures, can help purify our intended ESG bets to focus on the firms that are managing their businesses responsibly to create sustainable long-term growth. Additionally, for clients that desire full ESG integration with our investment models, we may not want unintentional bets offsetting the balance in other signals.
At Man Numeric, we believe we can find unique and orthogonal insights if we really understand the underlying data and extract the important components. We believe that creating a better measure of ESG relies on four key ideas:
- Using a principles-based approach that focuses on economic intuition and academic literature;
- Spending time to understand a few vendors and their processes so we can present the best combinations to our clients in each pillar of sustainable investing;
- Carefully applying normalizations and adjustments to regions, sectors and industries. We are always navigating a delicate balance between too much and too little data processing. We want to understand where differences arise and why exposures exist, so that we can adjust where it intuitively helps us better invest in sustainable firms with healthy long-term growth prospects; and
- Understanding what unintended factor exposure existing ESG signals contain in an effort to make our ESG factor as orthogonal as possible.
Conclusion
Data are the cornerstone of any quantitative process. Rigorous research requires data that are clearly defined, unbiased, and have a long history. ESG data lack some of these key attributes.
Man Numeric is actively trying to extract the useful information by thoroughly analysing ESG data. We have undertaken a stringent process to understand the data, what the indicators measure, how vendors represent the data, how the data has changed over time, what factors are relevant for different industries, and whether there are any biases in the data (vendor, industry, and region). By understanding and compiling the disparate pieces of messy data, we can potentially turn the off-the-shelf variables into a useful and informative signal.
The result is a principles-based approach that aims to identify companies making thoughtful long-term decisions. We believe that companies that take a long-term view towards being good stewards will ultimately be the ones that succeed.
You are now exiting our website
Please be aware that you are now exiting the Man Institute | Man Group website. Links to our social media pages are provided only as a reference and courtesy to our users. Man Institute | Man Group has no control over such pages, does not recommend or endorse any opinions or non-Man Institute | Man Group related information or content of such sites and makes no warranties as to their content. Man Institute | Man Group assumes no liability for non Man Institute | Man Group related information contained in social media pages. Please note that the social media sites may have different terms of use, privacy and/or security policy from Man Institute | Man Group.