The headwinds Chinese equities faced in 2018 are a constructive backdrop for 2019, in our view.
The headwinds Chinese equities faced in 2018 are a constructive backdrop for 2019, in our view.
January 2019
Introduction
If asked to invent a hostile scenario for the Chinese economy, an analyst would be hard-pressed to come up with something as nasty as the conditions that transpired in the first half of 2018. In summary, these were:
- The negative credit impulse of late 2017 and the more recent slowing in money supply;
- A resurgent US dollar, after the weakness of 2017;
- A consistently rising oil price: on the eve of the collapse in oil in the fourth quarter, oil was up 35% in CNY terms from the start of the year, and;
- A trade war with the US, threatening punitive tariffs on the majority of China’s exports to the US.
The havoc this wreaked on Chinese equities was considerable: from the January peak to year-end, the CSI300 Index was down almost 33%, the worst-performing major market in the world, and eclipsed only by Turkey and Argentina, which were in full-blown financial crises. Favourites among foreigners, that can compete in quality-terms with global leaders in their industries – HikVision, Midea, Wuliangye, for example – were down 40% or more.
It is our contention that the headwinds highlighted above are turning into tailwinds, and that an inflection in growth in the first half of 2019 has been cemented over the past few months as the credit impulse and monetary indicators have turned more positive. A turn in the cycle could open up a meaningful opportunity in Chinese equities given a substantial de-rating, historic spreads between cheap and expensive stocks and a capitulation evident in onshore equity stock prices.
Below, we conclude that:
- Credit conditions are easing, but versus previous cycles, the recovery in economic momentum could take longer to emerge, requiring more policy response from government and the People’s Bank of China;
- Moderating US growth momentum versus the rest of the world reduces some of the upward pressure on the US dollar. However, for a sustained depreciation, a change of course in central bank balance sheet policy is required. And though the Federal Reserve has opened the door to such a shift, we are not there yet;
- The collapse in oil prices is indisputably a tailwind. At fourth-quarter 2018 averages, China’s oil bill drops by USD100 billion, or 0.75% of GDP;
- Equities are cheap, cheap equities are very cheap, prices suggest capitulation. After comparable de-ratings, Chinese equities have tended to recover in subsequent years. Indeed, returns after capitulations have been overwhelmingly positive.
We have little to add on trade. Ongoing conflict is clearly negative, and a resolution mutually beneficial. With what is at stake for economies in both the US and China, we think (an opinion suffused with hope) that rational heads will prevail.
The Credit Cycle
Domestic credit to GDP stands at more than 200% in China, making the economy particularly sensitive to the downside in changing credit regimes. The measure we favour to gauge credit conditions is the ‘credit impulse’, which captures the change in new credit to GDP.1 This measure works reliably across geographies, as Figure 1 shows for the US.
Figure 1. US Credit Impulse
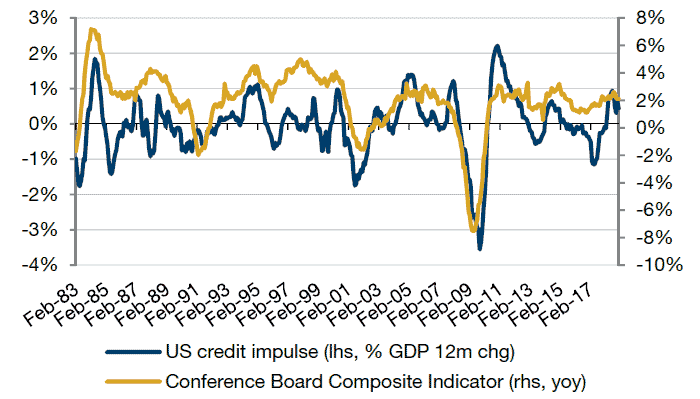
Source: Bloomberg, The Conference Board, Federal Reserve; As of December 31, 2018.
In China, we use the broadest measure of credit available, the PBoC’s ‘China Uses of RMB Funds of FIs – Total Fund Uses’. This stock of credit amounts to almost CNY210 trillion as of November 2018, c55% and 6% larger, respectively, than the more commonly cited ‘total loans’ and ‘all-system financing stock’ data. Given China’s large stock of debt and minimal variance in official real GDP growth rates, we like to look at measures of nominal growth to gauge cyclical momentum. We have found credit impulse to lead growth by about nine months on average, albeit with some differences in timing in each cycle.
Because credit impulse is a second derivative measure, we saw credit momentum in the last cycle peaking in late 2015, resulting in the subsequent reflation of the economy through 2016 and early 2017. Indeed, it is notable to us that exactly at the point that most commentators were panicking about a Chinese hard-landing, the credit stimulus was underpinning a recovery in growth momentum, a point which is similarly relevant today. The subsequent deceleration in credit momentum in 2016 and 2017 prefigured the growth slowdown in the latter part of 2017 and 2018. The latest credit impulse recovery became entrenched again from early 2018, suggesting that the normal recovery in economic activity is actually a little overdue.
Figure 2. Chinese Credit Impulse Indicator
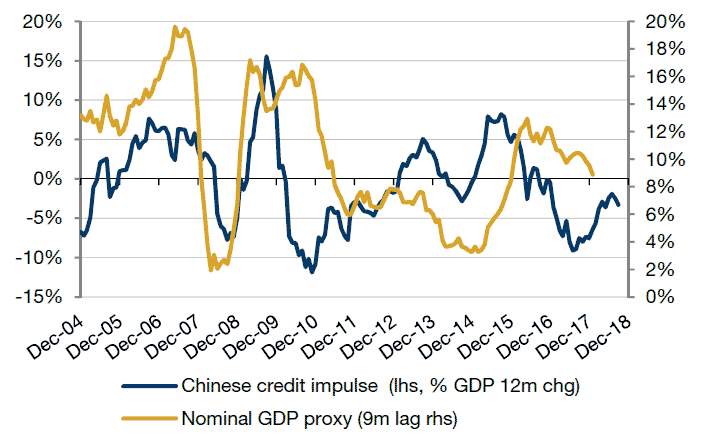
Source: Bloomberg, PBoC, National Bureau of Statistics; As of December 31, 2018.
There are two reasons that the recovery is still not evident in our view.
First, the bloated stock of credit in the economy, and the anecdotal evidence suggesting that much new credit is being channelled into evergreening existing loans to SOEs, may have reduced the credit multiplier (the growth of GDP for each new unit of credit).2
Second, 2018 witnessed a sharp slowdown in M1 growth as the PBoC has cracked down on shadow-banking activities. Figure 3 shows the 6-month change in China’s M1 growth versus the nominal GDP proxy used in the credit impulse chart in Figure 2. As our credit impulse indicator, this suggests that a bounce in growth momentum may be coming. However, unlike our credit impulse indicator, it suggests activity data will continue to deteriorate in the next few months, with a low more likely in the second quarter than the first. This gives us some pause, and suggests that patience will be a virtue in navigating the turn in the cycle this year.
Figure 3. China’s M1 Growth
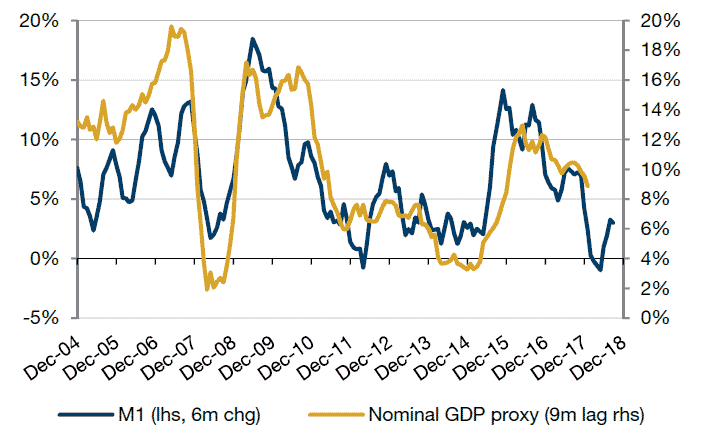
Source: Bloomberg, PBOC, OECD; As of December 31, 2018.
Curtailing the growth of the shadow banking is a clear long-term imperative in ensuring systemic stability. It should be noted that there has been some success over recent years, with shadow financing as a proportion of total credit declining from a peak of almost 18% in 2014 to c12% in late 2018 (Figure 4). But clearly, a rapid tightening of liquidity could have deflationary implications. As such, we anticipate greater efforts on the part of the monetary authorities to loosen financial conditions through early 2019.
Figure 4. Shadow Financing as a Proportion of Total Credit
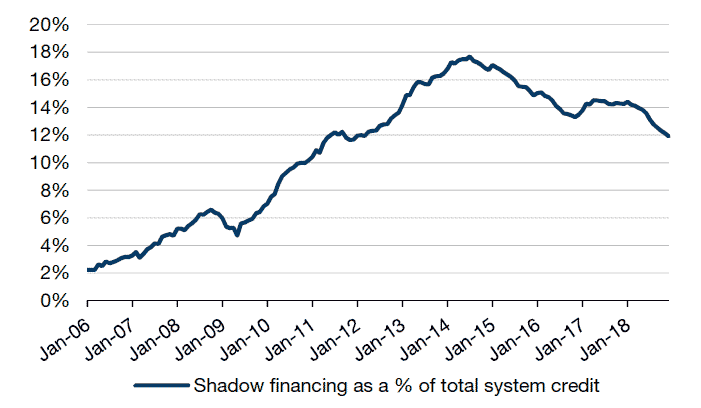
Source: Bloomberg, PBOC; As of November 30, 2018.
The US Dollar
The direction of the US dollar is invariably the making or breaking of emerging-market (‘EM’) equity performance everywhere. The only meaningful exception for onshore equities in China in recent years was the bubble period of late 2014 and early 2015, when the correlation was positive.
Figure 5. Correlation Between US Dollar and Onshore Equities in China
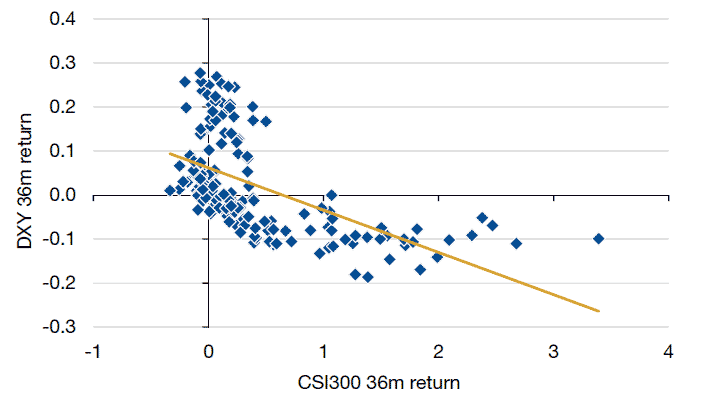
Source: Bloomberg; Time Frame Analysed: December 31, 2002 to December 31, 2018.
2018 was definitely a year when the US dollar broke EM, with very few exceptions. We believe we can attribute this to two principle drivers:
- Central bank balance sheets shrinking (principally the US and China), and;
- A widening growth differential for US versus the rest of the world.
On the former, the stated intentions of global central banks do not bode particularly well for global liquidity, and consequently suggest a risk that the USD rally continues. In Figure 6, we have aggregated the balance sheets of the Fed, PBoC, Bank of Japan, Bank of England, Swiss National Bank and European Central Bank in USD, calculated the 12-month change, and projected 2019 based on published central bank plans where available, or by extrapolating 12-month run rates where there is no published plan.
There is much that could turn out wrong with these assumptions, and they probably represent a worst case, not least because the FX rate will certainly vary (a weaker USD will inflate the values of all central banks except the Fed), and that central banks have discretion to change their plans, as has been alluded to recently by Fed Chair Jerome Powell. However, it is worth considering that since Powell has indicated the capacity to change course rather than a change of course already, further market volatility may be required.
Figure 6. Projected Change in Global Central Banks’ Balance Sheets
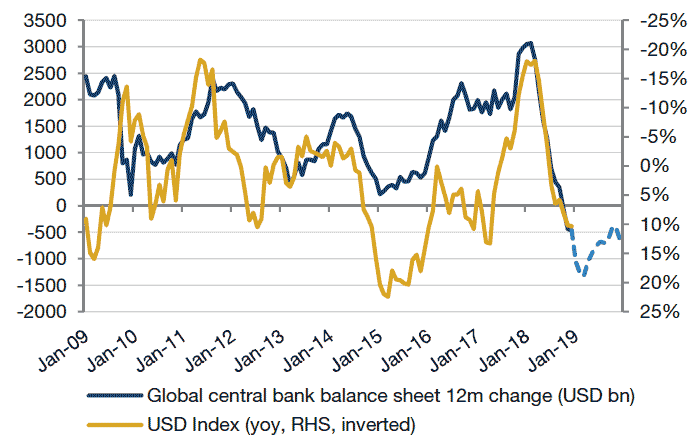
Source: Bloomberg, National Central Banks. Actual data to December 2018, projections to December 2019.
On the latter point, the widening US growth differential, the cooling of US bond markets reflects ebbing economic momentum, confirmed recently by softer activity data. In the event that this continues, we would expect the spread of 10-year yields of the US versus the rest of the world to continue narrowing. Figure 7 plots this spread (10-year US yields minus the 10-year yields of the constituents of the dollar index, weighted by the currency index weights) against the USD index.
Figure 7. US 10-Year Yields Versus the Rest of the World
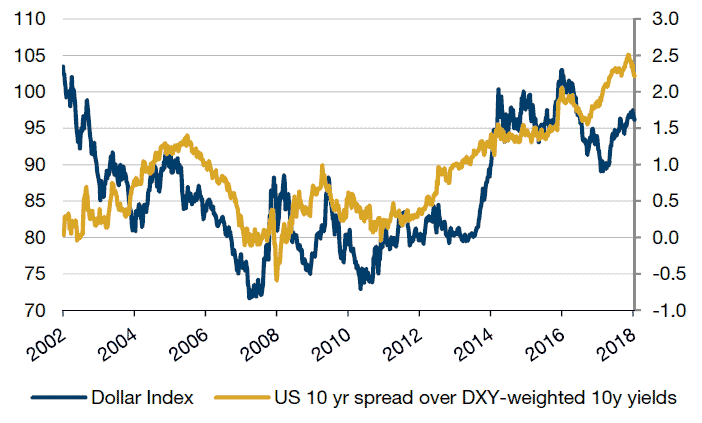
Source: Bloomberg; As of December 31, 2018.
The Oil Price
We wrote a paper in July 2018 discussing the impact of outbound tourism and oil on China’s current-account balance.3 By November 2018, China had recorded a primary hydrocarbon deficit of almost USD350 billion, a drag of c2.5% on GDP via net exports. Crude import volumes spiked in the last quarter of 2018, which we assume is an inventory build in the context of lower prices and weaker demand. Assuming the third-quarter 2018 run rate of c37 million tons per month in imports and the fourth-quarter average crude price ($58/barrel, 12% above spot, and 38% above fourth-quarter lows), China’s crude import bill drops by USD100 billion annually, c0.75% of GDP. This is a material windfall, which should be evident in the consumer’s spending pattern once confidence in the economy normalises.
Figure 8. Chinese Primary Hydrocarbon Balance
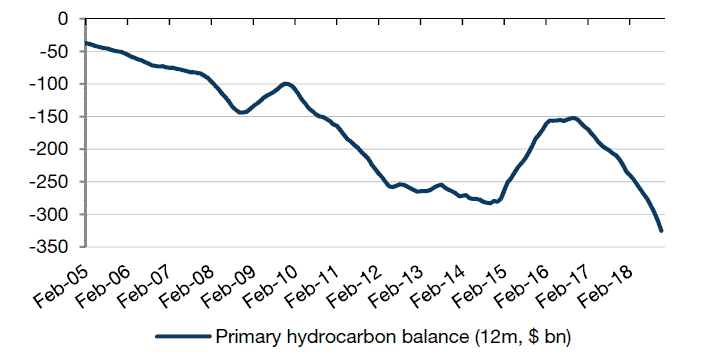
Source: Bloomberg, Customs General Administration PRC; As of December 31, 2018.
Where Does All This Leave Equities?
1. Earnings Estimates Have Held Up
Despite the economic gloom, earnings estimates in Chinese onshore equities have held up. The MSCI China (encapsulating Chinese equities listed onshore, and offshore in Hong Kong and the US) has seen forward earnings estimates come off by just 5% from the highs in mid-2018. The same measure for the CSI300 Index has seen downward revisions of approximately 1%. As Figures 9 and 10 show, the impact on multiples for Chinese equities has been a steep de-rating in absolute terms, and relative to international asset classes: the CSI300 is now priced at a 15% forward price-to-earning (‘PE’) discount to MSCI Emerging Markets, having been equally valued at the lows in 2016. This is potentially relevant as the MSCI considers increasing the inclusion factor for A-shares from 5% to 20% in the first quarter of 2019 – i.e., benchmark-oriented foreign investors may see the weight of China increase significantly in their benchmarks at a point when valuations are subdued.
Figure 9. Forward PE, EPS for the MSCI China
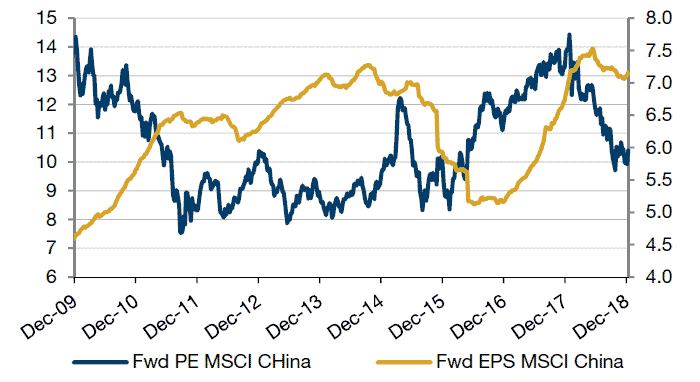
Source: Bloomberg; As of December 31, 2018.
Figure 10. Forward PE, EPS for the CSI300
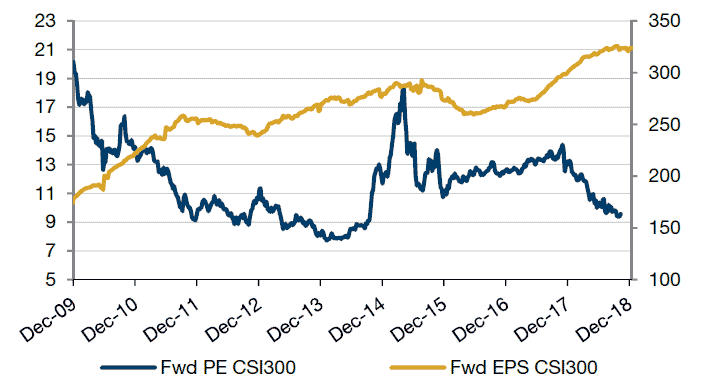
Source: Bloomberg; As of December 31, 2018.
We have looked at the frequency of such steep de-ratings by isolating years when earnings rise and PE multiples contract by more than 1 point. For the Shanghai Composite (which has the longest history of China’s onshore indices), we can find seven occasions in 21 years, of which four were followed by positive gains, with an average gain in the winning years of almost 60%. These hit rates are not particularly good, but we do note that the scale of the winning years substantially exceeds the losses of the losing years.
For MSCI China, the same analysis yields more interesting results, with positive years more than 70% of the time following a PE de-rating of more than 1 point. As the penetration of foreign capital increases, Chinese markets become more efficient and the investable universes converge into one large discrete asset class, we suspect that the historical behaviour of MSCI China will become more relevant for onshore markets in the future.
Figure 11. Deratings and Subsequent Moves in Stocks for the Shanghai Composite
| Shanghai | |||
|---|---|---|---|
|
|
EPS Change | PE De-rating | Stocks Next 12m |
| 1999 | 39% | -6.2 | 52% |
| 2003 | 40% | -9.0 | -15% |
| 2004 | 32% | -12.1 | -8% |
| 2005 | 3% | -2.3 | 130% |
| 2010 | 40% | -10.1 | -22% |
| 2011 | 6% | -4.2 | 3% |
| 2013 | 13% | -2.2 | 53% |
| 2018 | 5% | -4.6 | ? |
| Average | 25% | -6.6 | 28% |
Source: Bloomberg, Man GLG.
Figure 12. Deratings and Subsequent Moves in Stocks for the MSCI China
| MSCI China | |||
|---|---|---|---|
|
|
EPS Change | PE De-rating | Stocks Next 12m |
| 1998 | 26% |
-15.6 |
10% |
| 2001 | 3% | -5.9 | -16% |
| 2002 | 22% | -4.7 | 80% |
| 2004 | 30% | -3.6 | 16% |
| 2010 | 30% | -3.5 | -20% |
| 2011 | 13% | -3.9 | 19% |
| 2013 | 12% | -1.2 | 5% |
| 2018 | 11% | -4.5 | ? |
| Average | 19% | -5.5 | 13% |
Source: Bloomberg, Man GLG.
2. The Discount for Value Stocks Has Become Extreme
Stocks are cheap and have meaningfully de-rated. But beyond that, cheap stocks are very cheap. One way Man Numeric monitors value at an asset class level is by measuring the standard deviation of earnings yield spread between the top and bottom quartiles. This is shown in Figure 13 for onshore Chinese equities. The current reading has just retreated from the most extreme stretch since the dataset begins in 2010, which represents a potentially promising opportunity to be thinking about equity strategies with a strong tilt towards value.
Figure 13: Standard Deviation of Earnings Yield Spread Between Top and Bottom Quartiles for Chinese Equities
Source: Man Numeric; As of December 31, 2018.
3. Price-Only Measures Show a Rare Capitulation in Chinese Equities
In the last 30 years or so globally, markets go up the majority of the time – in the UK, US, Germany and China, approximately 53% of trading days are ‘up’ days. To gauge capitulation, we flip this observation on its head – what happens if, over defined periods, the majority of trading days are down rather than up? We have observed that above 55% down days in rolling 100-day sample periods (the threshold differs a little depending on geography), the probability of positive subsequent returns increases.
In China, we observed a cluster of such capitulation signals from late in the third quarter of 2018. As Figure 14 shows, the hit rates and degree of the wins increase substantially as the holding period increases. Indeed at three months, the odds of wins are little better than the normal 53%. This makes intuitive sense to us, as capitulations are by nature highly volatile and difficult, with much continuing damage done to stock prices. However, these findings strongly underpin our conviction that the balance of opportunities over slightly longer time horizons is firmly skewed to the upside.
Figure 14: Hit Rates and Degree of Wins for Shanghai Composite
| 1-yr Fwd Return Post Trigger | 1-m Return Post Trigger | 3-m Return Following Trigger | 6-m Return Post Trigger | |
|---|---|---|---|---|
| Count | 105 | 104 | 105 | 105 |
| Hit Rate | 80% | 66% | 56% | 57% |
| Average win | 51% | 6% | 11% | 22% |
| Average loss | -15% | -7% | -8% | -6% |
| Max win | 94% | 19% | 37% | 55% |
| Max loss | -18% | -22% | -19% | -12% |
Source: Bloomberg; As of January 11, 2019.
Figure 15: Shanghai Composite With Capitulation Signals
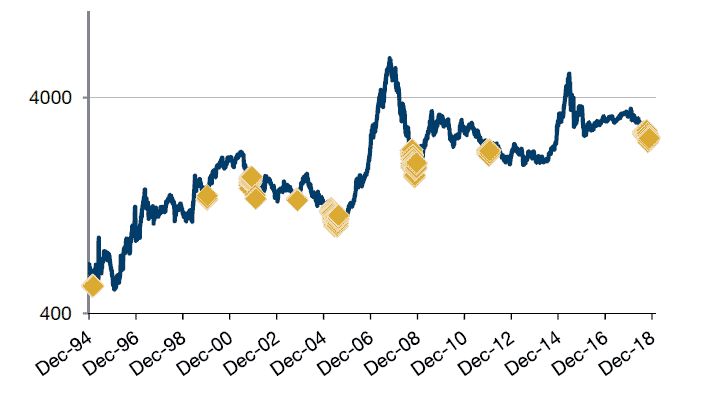
Source: Bloomberg; As of January 11, 2019.
Conclusion
In summary, the headwinds Chinese equities faced in 2018 are a constructive backdrop for 2019. Indeed, our conviction increases as we head to the second quarter, in what we believe should be a durable low in economic momentum.
1. See DNB Working Paper No. 218/July 2009, Credit & economic recovery, Michael Biggs, Thomas Mayer and Andreas Pick.
2. See IMF Working Paper No. 17/273, Credit & Fiscal multipliers in China, Sophia Chen, Lev Ratnovski, Pi-Han Tsai.
3. See Edward Cole’s ‘A farewell to arms – the inexorable decline of China’s external surplus’, July 2018.
You are now exiting our website
Please be aware that you are now exiting the Man Institute | Man Group website. Links to our social media pages are provided only as a reference and courtesy to our users. Man Institute | Man Group has no control over such pages, does not recommend or endorse any opinions or non-Man Institute | Man Group related information or content of such sites and makes no warranties as to their content. Man Institute | Man Group assumes no liability for non Man Institute | Man Group related information contained in social media pages. Please note that the social media sites may have different terms of use, privacy and/or security policy from Man Institute | Man Group.