In this paper, we discuss how finance theory can be used to try and optimally extract alpha and potentially generate consistent returns.
In this paper, we discuss how finance theory can be used to try and optimally extract alpha and potentially generate consistent returns.
July 2018
Alpha: the path to consistent returns
There is a Wikipedia page dedicated to ‘comic timing’. Most comedians would say it is a crucial part of their art. The craft of asset management has a rather less frivolous goal than laughter. Ensuring our clients can retire safe in the knowledge that their pension pots are healthy is not a matter for levity. However, the question of timing is important in asset management as well.
If asset managers could time when to overweight different asset classes or countries those pensions would be flush. Unfortunately, the debate over whether investors can time markets has almost been laid to rest. Even mean reversion, using past norms to assess the over- or under-valuation of particular markets, sectors or stocks, has been shown to be unreliable as a predictive tool for asset management practitioners.
The stock market historian and London Business School Emeritus Professor of Finance, Elroy Dimson, said: “Much of the evidence for mean-reversion is based on optical illusions based on hindsight. Investors – who sadly do not have the benefit of hindsight – will find that market timing, using mean reversion rules, is more likely to hurt performance than enhance it.”1
More recently there has been a focus on whether it is possible to time individual factor exposures – such as market beta, country, industry, or style (value or growth). Factor investing in the guise of ‘smart beta’ has been a boon for asset management marketers and index providers. Whether smart beta is either ’smart’ or ‘beta’ is beside the point – we broadly share Bill Sharpe’s definitional nausea – if you can time factors, you can certainly beat the market.2
If only our lives were so easy. Most practitioners will know that trying to time factors is also a road to perdition. The TMT (telecoms, media, technology) bubble that inflated in the late 1990s was, with the benefit of hindsight sadly not possessed by asset managers at the time, certainly irrational. If you believed in either factor timing or that valuations must mean revert, you would have been on the wrong side of an historic pain trade.
TMT (growth) stocks dominated market performance. The Nasdaq index tripled in three years between 1997 and 2000 (Figure 1). Fund managers with enviable track records lost their jobs and firms with storied histories went out of business by sticking to tried and tested value strategies and staying out of TMT. As John Maynard Keynes noted in the 1930s: “The market can remain irrational longer than you can remain solvent.”
Figure 1. Value managers were right about the TMT bubble. But how many stayed solvent?
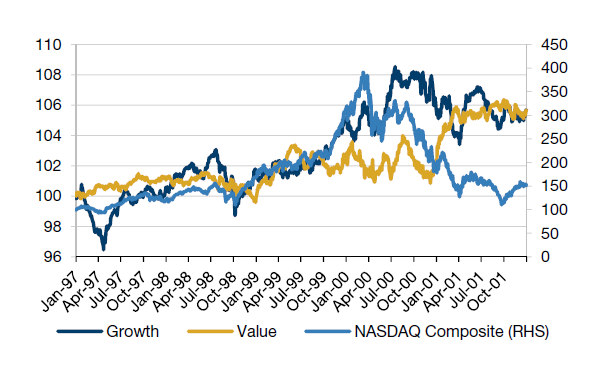
Source: Bloomberg. MSCI Barra models are used to represent Value and Growth.
Finance theory is now broadly in tune with hard learned experience. In a series of cogent and intellectually rigorous papers, AQR Capital Management founder, Cliff Asness, has conclusively shown that ‘the siren song of factor timing’ is one that will lure investors onto the rocks and should be ignored.3 Asness writes: “I find such timing strategies to be very weak historically, and some tests of their long-term power to be exaggerated and/or inapplicable.”
If theory and practice shows that investors cannot time markets or market factors, some might conclude that there is little point to active management. Dumb beta, passive indexed strategies, will at least guarantee market matching returns. Unfortunately, indexed returns are also likely to be meagre returns, particular in the immediate future after the long equity bull market since March 2009.
Beta can also be subject to sharp corrections, such as the 50% plus declines in European and US indices over the course of the global financial crisis between 2007 and 2009. Very few pension schemes have funding levels that would permit them to tolerate these losses given a reasonable level of equity exposure.
The gift of humility
Pension funds struggling to meet liabilities still want alpha. But no one labours under the misconception that generating alpha is easy. Our belief is that a highly skilled fund manager, focused on a country or sector, performing rigorous fundamental analysis and engaging with management at investee companies directly, can have an edge at stock picking. But it is only by combining the skill of many such managers and then optimally extracting alpha that can potentially generate consistent returns.
The GLG European Long-Short Strategy (‘ELS’) is comprised of a number of separate books that are run by portfolio managers who are specialized by industry, geography and investment style.
ELS has evolved over time, however.
After drawdowns in 2014 & 2016 we decided to enhance our portfolio construction processes (Figure 2). The drawdown in 2014 revealed a lack of diversification with too much of the strategy’s risk concentrated in the top 3 portfolio managers. In response to this drawdown, we refined the allocation process to avoid excessive concentration in a few investment teams. After the drawdown in 2016, we discovered heavy, unintended factor biases.
This was a humbling experience, but one that we learnt from. Nobel prize winner Harry Markowitz coined the phrase ‘diversification is the only free lunch in investing’ in 1952. More formally this found expression in Richard Grinold’s Fundamental Law of Active Management in 19895:
IR = IC × √N
IR = Information ratio
IC = Information coefficient or selection skill
N = Number of independent investment opportunities
According to the fundamental law, the information ratio of an asset manager is based on two variables, skill and breadth. Skill is measured by the information coefficient (IC) or correlation between the manager’s expected excess returns and the subsequent excess returns of the assets, and breadth as the number of independent positions in the portfolio.
It is fairly intuitive to understand that the greater the breadth of insights, the greater the efficiency of the portfolio. With that in mind, the first thing we did was to increase the number of books contributing to ELS. There are now up to twenty, mostly familiar sectoral portfolios: oil; consumer; cyclicals; utilities and others. There are also country books, for example the UK, and style books, such as risk arbitrage.
The biggest book of all is called Centre Book. Its existence was a direct product of the reengineering of our portfolio construction process and has become integral to ELS (we describe the role of Centre Book later).
The goal is to access skill (IC) while increasing breadth. Skill is the accumulated knowledge of fund managers of their sectors. It accrues through native intellect, experience and information gathering. This can be quantitative in nature, such as examining financial ratios and valuation history. But it is also qualitative. Often the greatest insights are gleaned from direct meetings with company management in our view.
Figure 2. Drawdown profile of ELS; learning the lessons of 2014 & 2016
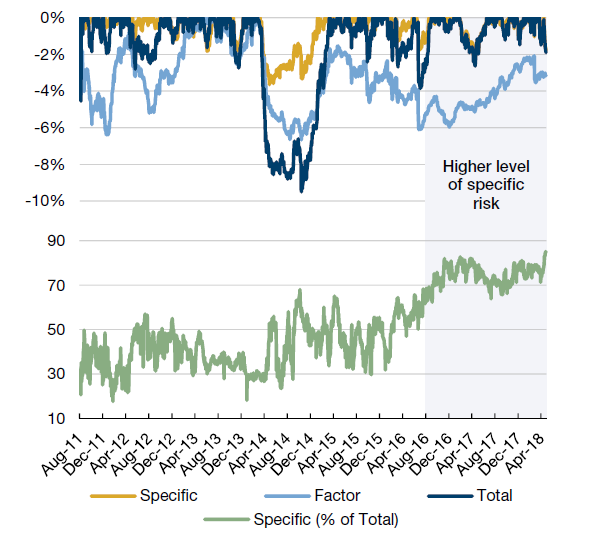
Past performance is not indicative of future results.
Source: Man GLG database 2018. Please note that the attribution data is based on a representative investment product that follows the GLG ELS Strategy.
We believe long-short equity portfolios have an inherent edge in this respect because ceteris paribus skill can be expressed through both long and short positions. We believe the biggest implementation constraint faced by most asset managers is that they cannot short. By contrast, running short positions is part of the DNA of hedge funds. In 2002, Roger Clarke (and his fellow authors) added a third term to the Fundamental Law: TC (transfer coefficient).6
IR = IC × √N × TC
EFFICIENCY = SKILL × BREADTH × IMPLEMENTATION
To the extent that a manager faces implementation constraints, the information ratio would be lower than the Fundamental Law suggests. All managers (or portfolios) should gain efficiency by adding to N. Greater breadth will have a bigger impact on information ratios for managers with higher ICs and TCs.
Figure 3 shows the stimulated distributions of risk and return for a portfolio of two, 1000 and 100,000 stocks for a manager with a hit rate of 54% (IC of 0.1) with a constant level of volatility of 4%. Return improves, left tail risk reduces and there is a better Sharpe ratio.
Figure 3. Eating the ‘free lunch’ – why diversification matters
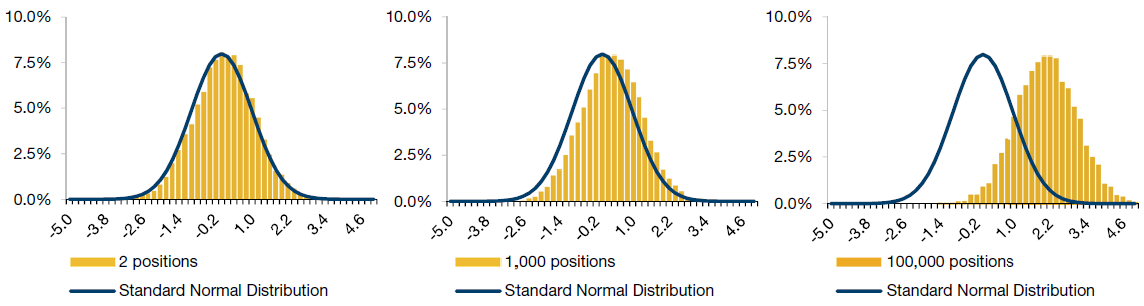
Data is simulated, purely theoretical and shown for information purposes only.
Source: Man GLG database. The simulated data does not represent actual performance of a strategy or fund and it should not be used as a guide to the future. This approach has inherent limitations, including that results may not reflect the impact material economic and market factors might have had on the investment manager’s decision-making and/or the application of any trading models had the strategy been managed throughout the period over which the simulated performance is illustrated.
Playing to our strengths: dialling up specific risk
In addition to increasing the number of books contributing to overall ELS portfolio we reoriented the portfolio toward specific risk. Figure 2 shows the large part that factor risk played in the 2014 and 2016s drawdown. The track record of the fund suggested that our portfolio managers had skill in picking stocks and adding alpha, but no skill in timing factors. The performance overall was suffering as a result of factor exposures.
Unless you seek to measure factor exposures it is unlikely you will spot them. Price momentum is a good example. Axiomatically an index beating portfolio will tend to be long price momentum. Investors will tend to be rewarded for holding this factor. However, price momentum is also subject to very sharp and sudden reversals. When it breaks down there tends to be knock-on effects and major market dislocation.
We upped specific risk from between 30% and 60% of overall exposure, to a target level of 75%. Specific risk – risk factors that affect a stock and company – at the microeconomic level, has the benefit of increasing diversification. But there is a downside. The lack of correlation between the positions of sector specialists, though never perfectly uncorrelated, dampens overall portfolio volatility.
Our portfolio managers also have a proprietary tool to determine the impact on the percentage of specific risk by adding or cutting a long or short position pre-trade, which is designed to maximise the manager’s competitive edge in pinpointing alpha. No more than 3% of the specific risk budget can be spent on one stock position, long or short. If a position goes over that it will either be hedged or cut.
To help enhance returns we scale volatility based on an ex ante target. Our experience has been there is an almost symmetrical relationship between leverage and realised volatility. For each turn of leverage there is an approximate 1.1% increase in volatility. So if the target volatility is 4.5%, roughly 4X leverage would be appropriate. We have a hard limit on leverage imposed by an independent risk group depending on the client-specified volatility target applied to the ELS strategy.
Figure 4 shows the diversification benefit of specific risk. The leverage applied to ELS has broadly doubled since August 2016. However, the volatility has barely budged at all, a counterintuitive outcome, but not a theoretical one. It is based on actual data on the realised volatility of ELS over this time period.
Dialling down systemic risk
Simultaneously we diversify systemic risk. Each risk factor – market, industry, style and country – is subject to stress testing, specifically a 16 standard deviation move, which is statistically equivalent of year of typical trading in a single day (the square root of 250 trading days). After applying this relatively severe stress test, we hedge out any factor risk in the portfolio exceeding 16.5% of the risk budget.
Another challenge here is that these commonly used risk factors are pre-defined. A risk management system based on pre-determined factors will only find what it knows to look for. We have found that systemic risk may be hidden as a result of crowded factors or factors that fall outside of traditional risk management frameworks.
Crowding is generally regarded as bad. We are agnostic. Without the crowd there is nothing to push a stock price your way, whether long or short. But we do test for crowding because when there is a deleveraging event, when the market regime shifts to ‘risk off’, the crowd is no longer your friend – everyone is rushing for the exit at once.
Such events, however, cannot be predicted. Attempting to do so is akin to market timing. We trust that we remain sufficiently diversified, that our portfolio managers will add alpha over time and our risk management framework is robust.
In addition to the fundamental risk model we overlay a factor statistical risk model. This looks for co-movement in stocks without ascribing a fundamental rationale for price developments. This screen is expected to pick up any factor risk not attributable to fundamental factors. These tend not to be persistent but can be meaningful, for example around policy changes or political events.
Factor hedging is designed to eliminate factor biases at the strategy level. An objective function – an equation optimised given certain constraints and with variables that need to be minimised or maximised – is used to control transaction costs. On top of this hedging, Centre Book, the biggest underlying book in the overall portfolio is designed to extract each team’s specific risk alpha in an efficient way.
It reallocates the overall portfolio risk budget from factor to specific risk and aims to improve the return characteristics of existing alpha decisions. Figure 4 shows how targeting specific risk cuts both the left (loss-making) fat tail of the distribution and the duration of drawdowns.
Figure 4. Drawdown distribution analysis for two portfolios with high and low specific risk
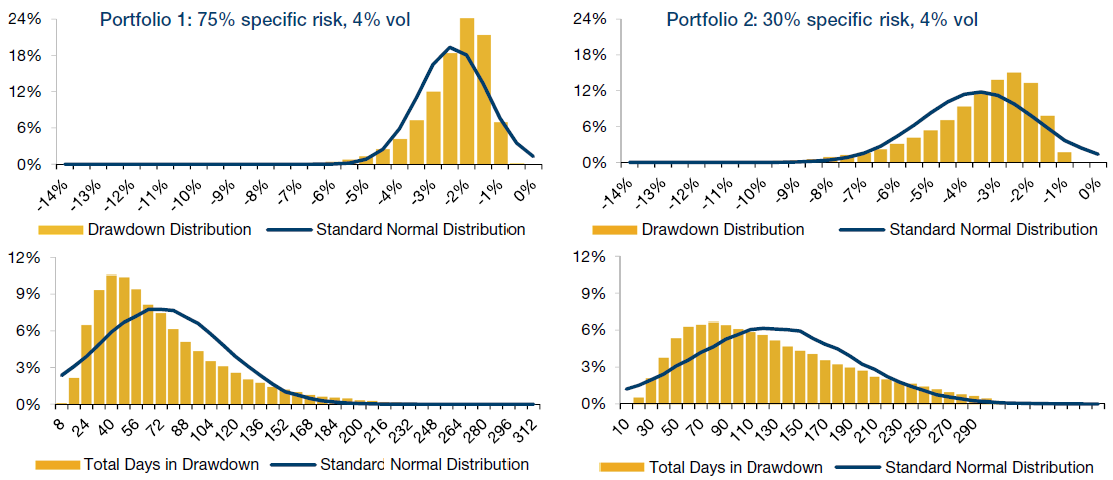
Data is simulated, purely theoretical and shown for information purposes only.
Source: Man GLG database. The simulated data does not represent actual performance of a strategy or fund and it should not be used as a guide to the future. This approach has inherent limitations, including that results may not reflect the impact material economic and market factors might have had on the investment manager’s decision-making and/or the application of any trading models had the strategy been managed throughout the period over which the simulated performance is illustrated.
The role of Centre Book
Breadth is important. It is analogous to playing roulette. If the wheel spins 100 times and the player bets GBP10 each time, the expected return is the same as a single bet of GBP1000. For the casino owner, however, the risk-reward ratio of 100 GPB10 bets is far better. But increasing specific risk is not simply a by-product of having a greater number of underlying portfolios taking a greater number of positions.
Within the breadth definition in Grinold’s Fundamental Law, ‘independence’ is equally significant. For example, the correlations of market indices are lower than the correlations of stocks within an index. Also, as noted above, factors can and often do drive several different active positions. The number of active positions alone is not indicative of the independence of those positions.
Most multimanager platforms typically place risk management and capital constraints on their managers, such as a maximum permitted VaR (Value at Risk). We would rather give our managers as much free rein to identify alpha and express their investment skill (IC) as possible. However, we also recognise that all human beings, even skilled investors, are prone to behavioural biases.
These have been well documented in the work of Nobel prize winning economists such as Daniel Kahneman, Richard Thaler and Amos Tversky. They include confirmation bias, taking greater account information that reinforces existing beliefs, loss-aversion (greater fear of loss than equivalently sized gain) and overconfidence. Humans are not very good at either accounting for risk or managing the risk-reward trade-off.
Centre Book is a systematic, quantitative portfolio construction process within ELS. It reviews the alpha ideas of the underlying ELS managers and seeks to optimally size and combine them. It is not a hedging book, nor is it replicating existing positions. It seeks to capture the most productive trades from all of the portfolios and size them so they are optimal at the overall portfolio level. Most positions should be raised to the point where there the marginal contribution to risk is equivalent with their expected alpha.
It helps to further diversify the breadth of ELS by upsizing underinvested positions and aims to produce 90% specific risk. Since the inception of Centre Book in 2016 it has typically been approximately 50% correlated with the overall portfolio of ELS. This systematic portfolio construction process frees the underlying managers to focus on where there skill is – researching stock ideas and alpha generation – rather than giving them tightly controlled risk budgets that then present a portfolio construction problem.
We believe a systematic process is the only practical way to estimate alphas, correctly size and optimise them and account for correlations in a large long-short equity portfolio across a broad range of markets and sectors. If ELS has an overall Sharpe ratio of 2 and Centre Book a Sharpe of 1.5, and the correlation is 50%, then in the right mix it would deliver an overall Sharpe of 2.5.7
Figure 5. ELS portfolio risk allocations
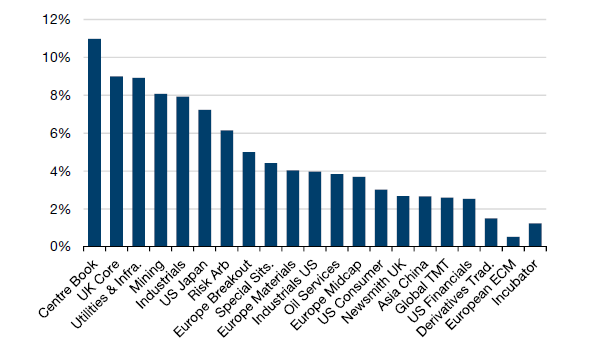
Source: Man GLG database. As at 1 June 2018.
The practice of theory
Centre Book has helped increase the level of specific risk and diversification, delivering breadth not just via a large number of positions, but also in terms of independence. Practitioners often regard finance theory with suspicion. What appears elegant and robust on the pages of an academic journal may fail the real world test of being able to find expression in portfolios.
The combination of bottom up stock pickers with a demonstrable ability to generate alpha and a systematic quantitative process for seeking optimal portfolio construction, within a risk managed but relatively unconstrained framework is powerful in our view. It enables human skill to find expression through stock picking and quantitative rigour to be systematically bought to bear on portfolio construction. We believe ELS is a happy union between the best of finance theory and the experience of fund management practice.
1. Dimson, Elroy, Marsh P., and Staunton M. (2013). “Mean Reversion” in Credit Suisse Global Investment Returns Yearbook 2013.
2. Bill Sharpe, quoted in Financial Times, “Is ‘smart beta’ smart enough to last?”, John Authers. 11 June 2014.
3. Clifford S. Asness, “The Siren Song of Factor Timing”, Journal of Portfolio Management, Quantitative Equity Strategies Special Issue, 2016; “My Factor Philippic”, https://www.aqr.com/Insights/Perspectives/My-Factor-Philippic.
4. Cohen, Randolph B. and Polk, Christopher and Silli, Bernhard, Best Ideas (March 15, 2010). Available at SSRN: https://ssrn.com/abstract=1364827 or http://dx.doi.org/10.2139/ssrn.1364827.
5. Grinold, Richard C. “The Fundamental Law of Active Management”, Journal of Portfolio Management, vol.15, no 3 (Spring, 1989).
6. Clarke, Roger; de Silva, Harindra; and Thorley, Steven. “Portfolio Constraints and the Fundamental Law of Active Management.” Financial Analysts Journal, September-October 2002.
7. Sharpe ratio is a measure of risk-adjusted performance that indicates the level of excess return per unit of risk. It is calculated using the risk-free rate (3 month interbank rate) in the appropriate currency over the period analysed. Where an investment has underperformed the risk-free rate, the Sharpe ratio will be negative. As the Sharpe ratio is an absolute measure of risk-adjusted return, negative Sharpe ratios can be misleading and are therefore shown as n/a.
You are now exiting our website
Please be aware that you are now exiting the Man Institute | Man Group website. Links to our social media pages are provided only as a reference and courtesy to our users. Man Institute | Man Group has no control over such pages, does not recommend or endorse any opinions or non-Man Institute | Man Group related information or content of such sites and makes no warranties as to their content. Man Institute | Man Group assumes no liability for non Man Institute | Man Group related information contained in social media pages. Please note that the social media sites may have different terms of use, privacy and/or security policy from Man Institute | Man Group.