2019 may see risk premium being embedded – finally – in emerging-market debt, in our view.
2019 may see risk premium being embedded – finally – in emerging-market debt, in our view.
January 2019
Introduction
2018 was characterized by three developments, in our view: the end of the Chinese tailwind for emerging market (‘EM’) assets, the dramatic alteration in liquidity conditions driven by the reversal of quantitative easing (‘QE’) activities from the large central banks (the Federal Reserve, the European Central Bank and the Bank of Japan) and the change in the issuance profile of US Treasuries as a consequence of the increased deficits generated by the tax reform that begun to be implemented in 2018.
We believe that these three developments will crowd out the demand for risk assets (i.e. assets that were an alternative for high quality developed markets government bonds) and reduce (or, in extreme cases, cause reallocation from) the demand for substitute assets, of which EM bonds are a small part. This in turn will require a dramatic change in EM managers’ investment approach, which has historically been characterized by a structural bias to build riskier (i.e. higher beta) portfolios than the benchmarks.
A Look Back
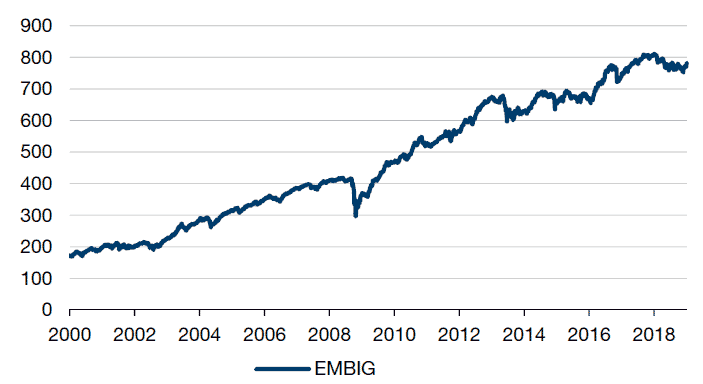
Between January 3, 2000 – roughly when the impact of the acceleration in Chinese growth began to meaningfully affect global aggregate demand – and December 5, 2017 – after the peak in QE activities had been reached, the JPMorgan Emerging Market Bond Index Global Composite (‘EMBIG’) returned an annualized 9.03% (Figure 1).
Figure 1. EMBIG Historical Returns
Source: Bloomberg, as of January 8, 2019.
This 9.03% annualized return is almost exactly equivalent to the average yield on the index plus the impact of the decrease in Treasury yields for the period: the contribution from yield to such return was 7.53% p.a. (average yield on the EMBIG for the period) and the contribution from Treasury yield compression was 1.37% p.a., for a total compounded of 9.01% p.a. There are only 2 basis points for the total annualized return that are not explained by the yield and yield compression factors. This has been possible because for this 17-year period, default rates were close to zero. As a consequence, the alpha trade during this period consisted in being structurally overweight beta, which is what many EM active managers have been doing (Figure 2).
Figure 2. Average 12-Month Rolling Beta for Selected EM Hard Currency Managers Versus Benchmark
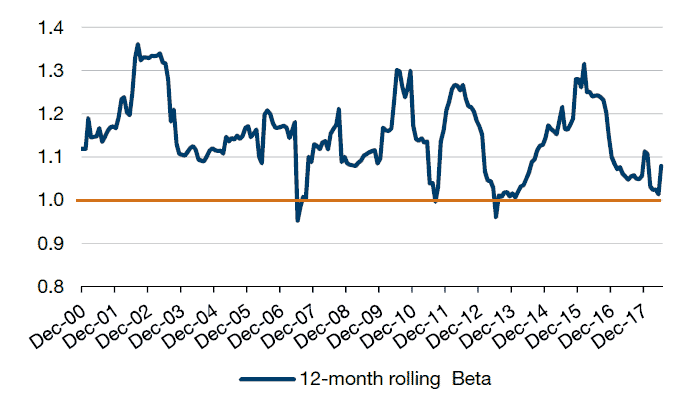
Source: eVestment. As of September 28, 2018; Chart 1 represents the 29 managers within the eVestment Emerging Markets Fixed Income – Hard Currency universe that have provided monthly performance to eVestment since at least 2000. This pool does not include any Man GLG funds. The benchmark refers to the preferred benchmark of each manager.
As Figure 2 shows, regardless of what the index performance, valuation or technicals were at any given point from 2000 onwards, the average manager in this subset almost never brought their beta risk below that of the benchmark. Even if a manager experiences significant draw-downs in short periods, as long as defaults are close to non-existent, the optimal approach consists in keeping the risk – and even adding to it – on dips.
In the case of EM local currency funds, there appears to be a bias toward running portfolios with structurally high allocations to rates and credit overlays, where the FX exposures have been closer to the benchmarks.1 This, in essence, constitutes the local benchmarked version of a high beta approach, where most managers in this subset have essentially abandoned the idea of running significant currency exposure variances versus benchmarks.
A Look Forward: Crowding Out
Going forward, the net supply of high-quality government bonds (and/or high-quality mortgage backed securities) may increase as a consequence of the quantitative tightening policies implemented by the Fed, the end of QE by the ECB and the reduction in the amount of bond purchases performed by the BoJ; as well as by the increase in US Treasury issuance to fund the larger deficits.
There has been a significant change in the net supply of high-quality government bonds (Figure 3). In 2017, expansion of central banks’ balance sheets helped reduce the net supply of bonds (or increase the demand, depending on the drivers of the balance sheet expansion) by about USD757 billion. In 2018, supply increased by USD833 billion. In 2019, we estimate that the supply will further increase by USD1.23 trillion.2
One saving grace for risk assets in 2018 was the fact that as a consequence of the tax amnesty granted with the reform, approximately USD950 billion of funds (likely held in money-market assets outside of the US) were repatriated and used at least partially to buy back stock, or pay off debt. This capital repatriation and the reallocation of those funds from cash to risk assets (either via buy backs or debt redemption) helped reduce the crowding out effect that the increase in net supply of high quality bonds would have had on risk assets in 2018.
However, as Figure 3 shows, the situation is going to worsen in 2019, in our view, and there will be no additional repatriation of capital capable of softening the crowding out effect on risk assets.
Figure 3. Net Change in US, European and Japanese Bond Supply
(USD billions, ‘-‘sign implies increase in supply i.e. to be absorbed by private market participants)
| 2016 | 2017 | 2018 | 2019 | |
|---|---|---|---|---|
| Fed Balance Sheet change | -35 | -3 | -409 | -600 |
| ECB Balance Sheet change | 991 | 894 | 218 | 0 |
| BOJ Balance Sheet change | 855 | 401 | 333 | 237 |
| Treasury net issuance (- SOMA Treasury unwinding) | -710 | -535 | -975 | -867 |
|
Total change in government bond and MBS net supply |
1101 | 757 | -833 | -1230 |
| T-bills T-notes, bonds and TIIPS Treasury unwinding (as part of SOMA) |
304 406 0 |
138 415 -18 |
436 791 -252 |
436 791 -360 |
Source: Haver Analytics and Man GLG calculations and estimates. Projections for 2019 assume that the Fed sticks to its plan, ECB ceases to expand its balance sheet after winding down tapering in 4Q18, and BOJ continues to inject liquidity at the same pace observed in 2H17, with tapering starting in April 2019. As of January 2, 2019. Estimates are for illustrative purposes only.
So, from 2019 onwards, private-market participants will have to absorb a net supply of USD1.23 trillion a year, in our view. This is roughly equivalent to 4.8 times the increase in stock buybacks executed in 2018 versus 2017. Indeed, stock buyback execution increased from USD519 billion in 2017 to USD775 billion in 2018, according to Goldman Sachs. This implied a net change of USD256 billion. Alternatively, USD1.23 trillion is approximately 2.9 times all of the USD-denominated debt issued by EM sovereigns and corporates in 2018. In other words, we may be about to witness a competition for survival of the fittest among risk assets due to the increased funding costs associated to the crowding out process described so far. As a consequence, one could expect default rates to go back at least to historical averages (i.e. those seen in the 1990s or even before) or higher, especially given the composition of the EMD indices today, where approximately 30% of the countries are B-rated or lower in the EMBIG Diversified Index, the highest level since 2005 (and compared to the recent low of 10% in 2009).
The EM Outlook Over Our Investment Horizon
We believe we have not yet seen the full effect the acceleration of the issuance of long-dated bonds (and the injection of duration associated to it) by the US Treasury in the second half of 2018 will have in crowding out risk assets. We would expect to see such impact only in the first quarter of 2019 (as there are lags between the change in net supply of US debt, the changes in the Treasury cash balances, and EM spreads and currencies). We believe that this impact, and the continuation of peak levels of net supply of high-quality government bonds, is going to continue for as long as the Fed is in quantitative tightening and the US Treasury continues to run the current deficits. Indeed, the short-term beta to benchmark employed by EM hard-currency managers ended 2018 at its peak (Figure 4). Even managers in the lower quartile of beta exposure are very close to the benchmark at this point.
Figure 4. 6-Week Beta to Hard Currency Benchmark Run by the 21 Largest EM External Debt Mutual Funds
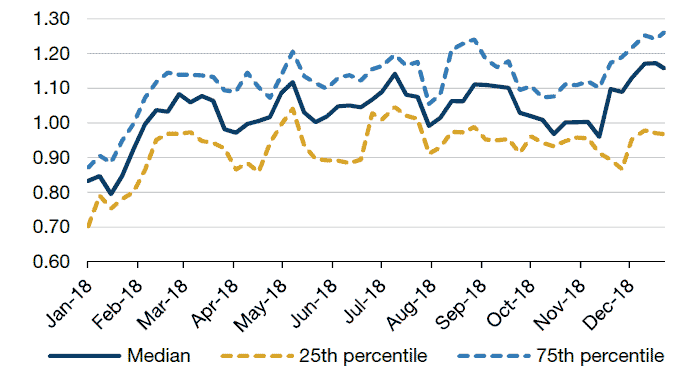
Source: Bloomberg and Man GLG internal calculations. The above is represented by the 23 mutual fund managers within the eVestment Emerging Markets Fixed Income – Hard Currency universe that report daily returns via Bloomberg. The content of this slide should not be construed as a recommendation for purchase or sale. Please note these funds may be different than the strategies deployed by Man GLG, and they may be subject to additional fees and restrictions and they are not intended to act as benchmark for the Man GLG Strategy. These funds are not intended to be representative of the entire hard currency and local currency universes and are being shown for informational purposes only. We make no representation that past performance is indicative of future results.
We observe something similar across EM local currency funds (Figure 5).
Figure 5. 6-Week Beta to Local Currency Benchmark Run by the 21 Largest EM Local Debt Mutual Funds
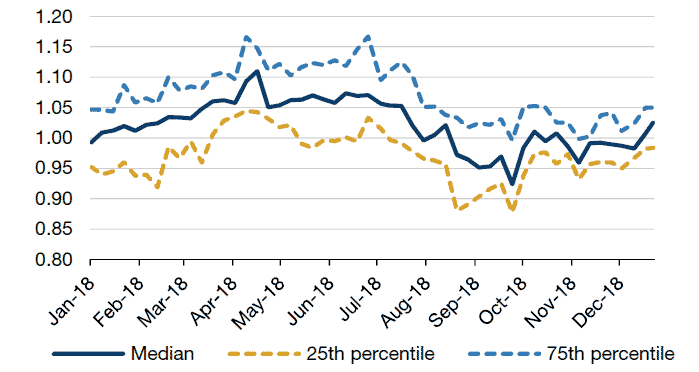
Source: Bloomberg and Man GLG internal calculations. The above is represented by the 21 mutual fund managers within the eVestment Emerging Markets Fixed Income – Local Currency universe that report daily returns via Bloomberg. The content of this slide should not be construed as a recommendation for purchase or sale. Please note these funds may be different than the strategies deployed by Man GLG, and they may be subject to additional fees and restrictions and they are not intended to act as benchmark for the Man GLG Strategy. These funds are not intended to be representative of the entire hard currency and local currency universes and are being shown for informational purposes only. We make no representation that past performance is indicative of future results.
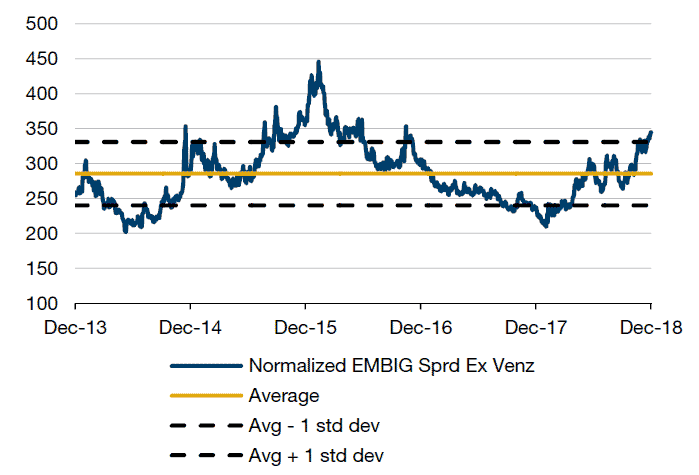
We believe the increase in beta, implemented by the majority of EM managers in the last quarter of the year, is a consequence of the long-held structural bias toward running higher risk than that of the benchmark against the dip experienced by EM hard and local currency assets in 2018. Indeed, EMBIG spreads ex Venezuela (eliminated due to the noise it injects in the calculations) ended 2018 roughly one standard deviation wide to the 5-year average (Figure 6).
Figure 6. Normalized EMBIG Z-spread ex Venezuela (Basis Points)
Source: Bloomberg, JPMorgan. As of December 31, 2018. Market data provided for illustrative purposes only and is in no way indicative of any product or service provided by Man GLG or any of its affiliates.
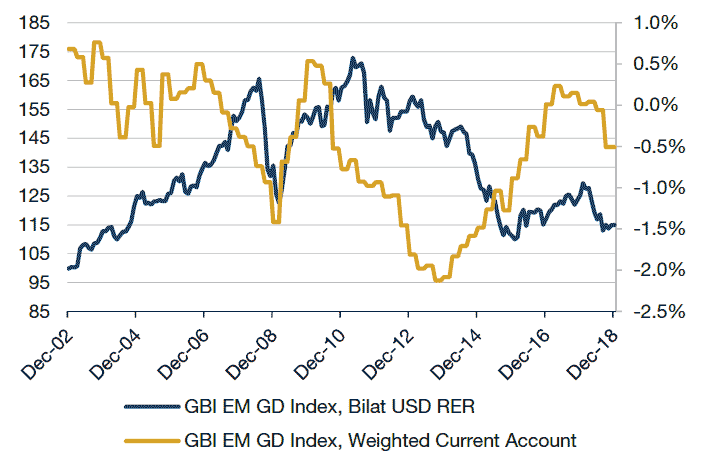
Something similar happens when we look at EM currency valuations: the valuations of EM currencies versus the US dollar are in the low end of the range that we have seen in the last 16 years (Figure 7).
Figure 7. JPM GBIEMGD Bilateral Real FX Versus USD and Current Account Balance/GDP
Source: Bloomberg and Man GLG database, as of December 31, 2018.
The beta increase implemented by EM managers in the fourth quarter of 2018 is implicitly counting on a reversion to the mean. However, we are skeptical that such a reversion could happen for the following reasons:
- We believe we have yet to see the peak of the crowding out effect from the increase in the net supply (or reduction in the net demand) of high quality government bonds described above, which may be significant;
- Objectively, the credit quality of the EMBIG is the worst we have seen in the last five years. In December 2013, 74% of the index was investment grade, and 7% was frontier, with commodity prices substantially higher than today. As of the end of 2018, only 59% of the benchmark was investment grade, while 15% was frontier, with commodity prices closer to the lower end of the ranges for the period;
- It is quite concerning to see that EM current accounts/GDP could not make new highs between early 2016 and now, despite the fact that EM currency valuations remained in the cheaper end of the range for the last 15 years. Clearly, the macro deterioration represented by higher levels of debt/GDP and higher rates of taxation, coupled with lower commodity prices, have made it much more difficult for these currency valuations to revert to the historical mean;
- Fifteen countries in the EMBIG, which account for close to 11% of the index market value, contribute roughly 38% of the Z-spread offered by the benchmark. In a global environment where only the ’fittest’ are likely to be able to make the adjustments required continuing to service their debt, one may see a significant increase in default rates at least among such countries;
- In the case of the local bond index, investors should not forget that the benchmark is highly concentrated and some of the larger countries have either histories of use of capital controls, and/or highly complicated debt/GDP dynamics. These are likely to become issues if, as we believe, market participants are not appropriately pricing the magnitude of the crowding out effects that we described.
Conclusion
We believe that both EM hard and local currency will have a difficult 2019 as a consequence of the global tightening in liquidity conditions described above. This may, in turn, bring EM default rates close to averages not seen since the 1990s, which could prove to be very challenging to the majority of EM asset managers. However, we believe we are finally beginning to see risk premium embedded in this asset class again (as well as in other credit asset classes). This could help investors, that are still capable to deploy assets in a very differentiated way, to generate attractive absolute and relative return performances over the next few years.
- Source: Bloomberg. Please note that the opinions discussed below are solely those of the authors and do not necessarily reflect those of Man Group plc or any of its subsidiaries.
- Projections for 2019 assume that the Fed sticks to its plan, ECB ceases to expand its balance sheet after winding down tapering in 4Q18, and BOJ continues to inject liquidity at the same pace observed in 2H17, with tapering starting in April 2019.
You are now exiting our website
Please be aware that you are now exiting the Man Group website. Links to our social media pages are provided only as a reference and courtesy to our users. Man Group has no control over such pages, does not recommend or endorse any opinions or non-Man Group related information or content of such sites and makes no warranties as to their content. Man Group assumes no liability for non Man Group related information contained in social media pages. Please note that the social media sites may have different terms of use, privacy and/or security policy from Man Group.